Free Access
Fig. 5.
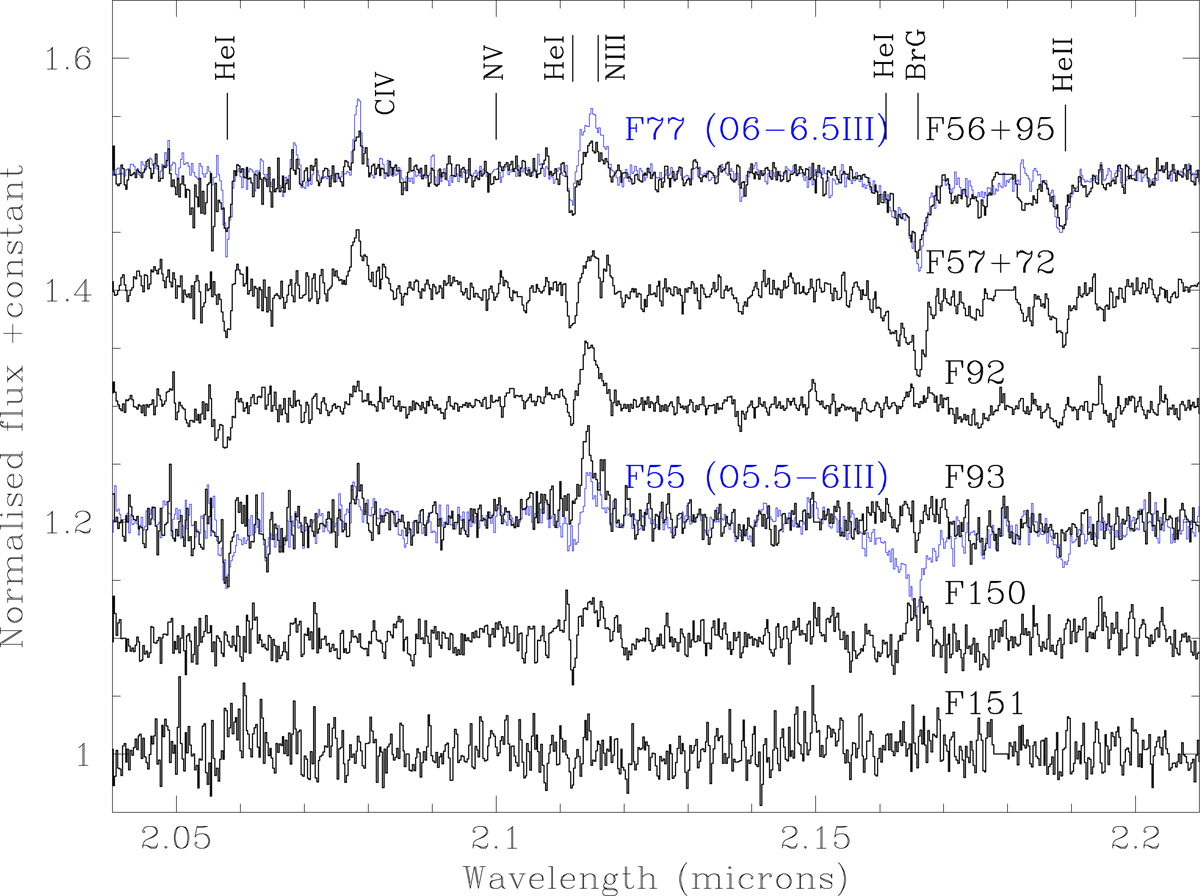
K-band spectra of the blends of F56+F95 and F57+72 along with the anomalous souces F92, F93, F150 and F151 (see Sect. 3.1). Spectra of the cluster members F55 and F77 are overplotted in blue for comparison.
Current usage metrics show cumulative count of Article Views (full-text article views including HTML views, PDF and ePub downloads, according to the available data) and Abstracts Views on Vision4Press platform.
Data correspond to usage on the plateform after 2015. The current usage metrics is available 48-96 hours after online publication and is updated daily on week days.
Initial download of the metrics may take a while.