Free Access
Fig. 3.
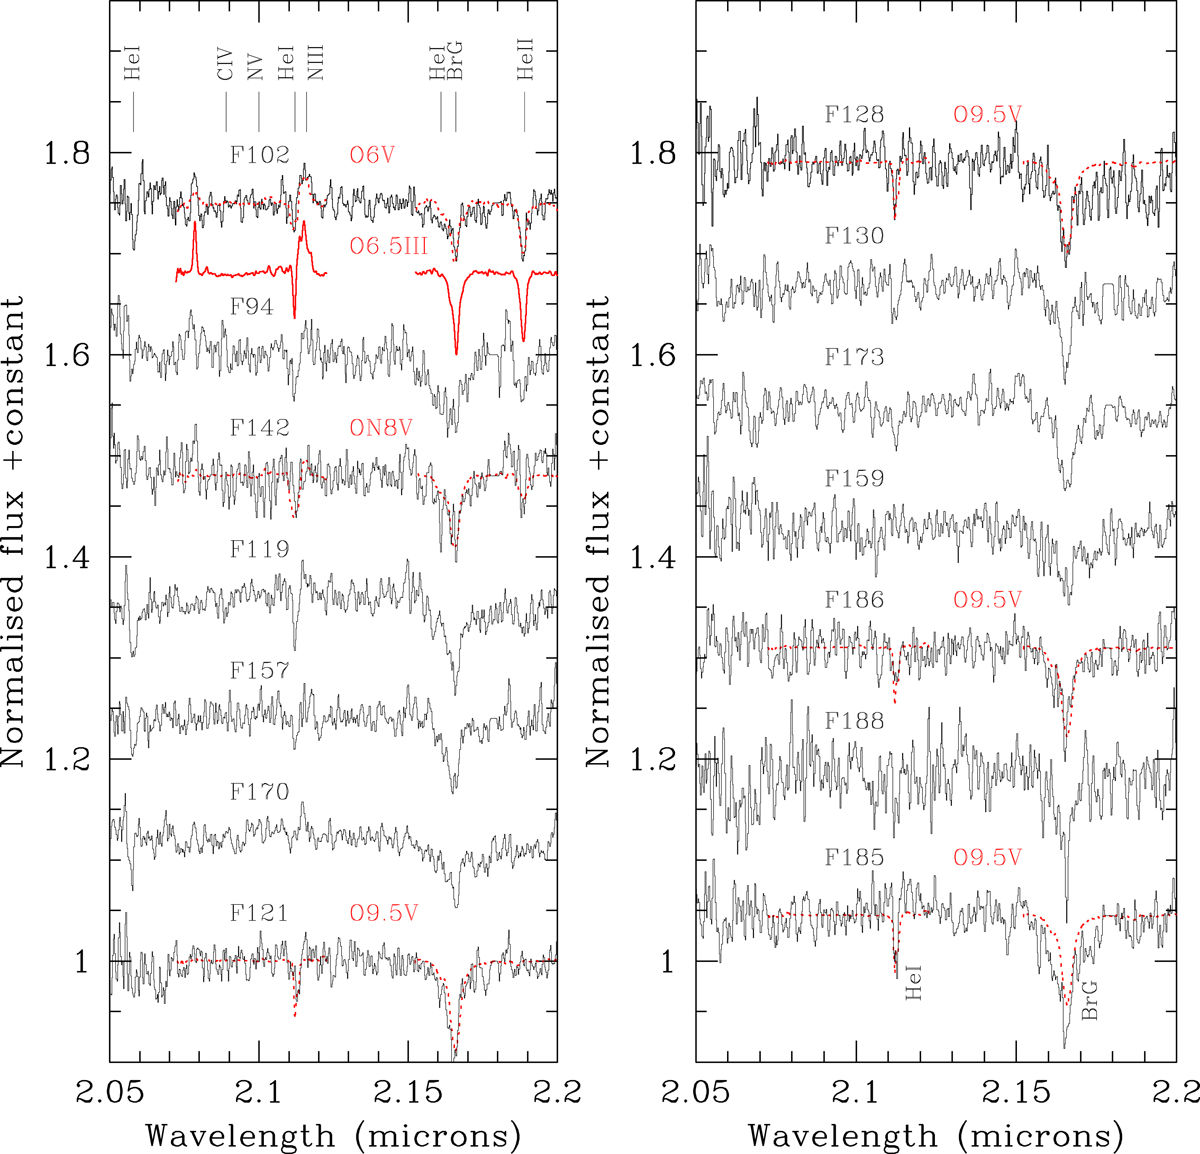
K-band spectra of additional giant and main sequence cluster members; these have been rebinned to improve the S/N. Comparison spectra for O6 V (HD 5689), O6.5 III (HD 190864), ON8 V (HD 13268) and O9.5 V (HD 37468) are overplotted in red and from Hanson et al. (2005).
Current usage metrics show cumulative count of Article Views (full-text article views including HTML views, PDF and ePub downloads, according to the available data) and Abstracts Views on Vision4Press platform.
Data correspond to usage on the plateform after 2015. The current usage metrics is available 48-96 hours after online publication and is updated daily on week days.
Initial download of the metrics may take a while.