Fig. 9.
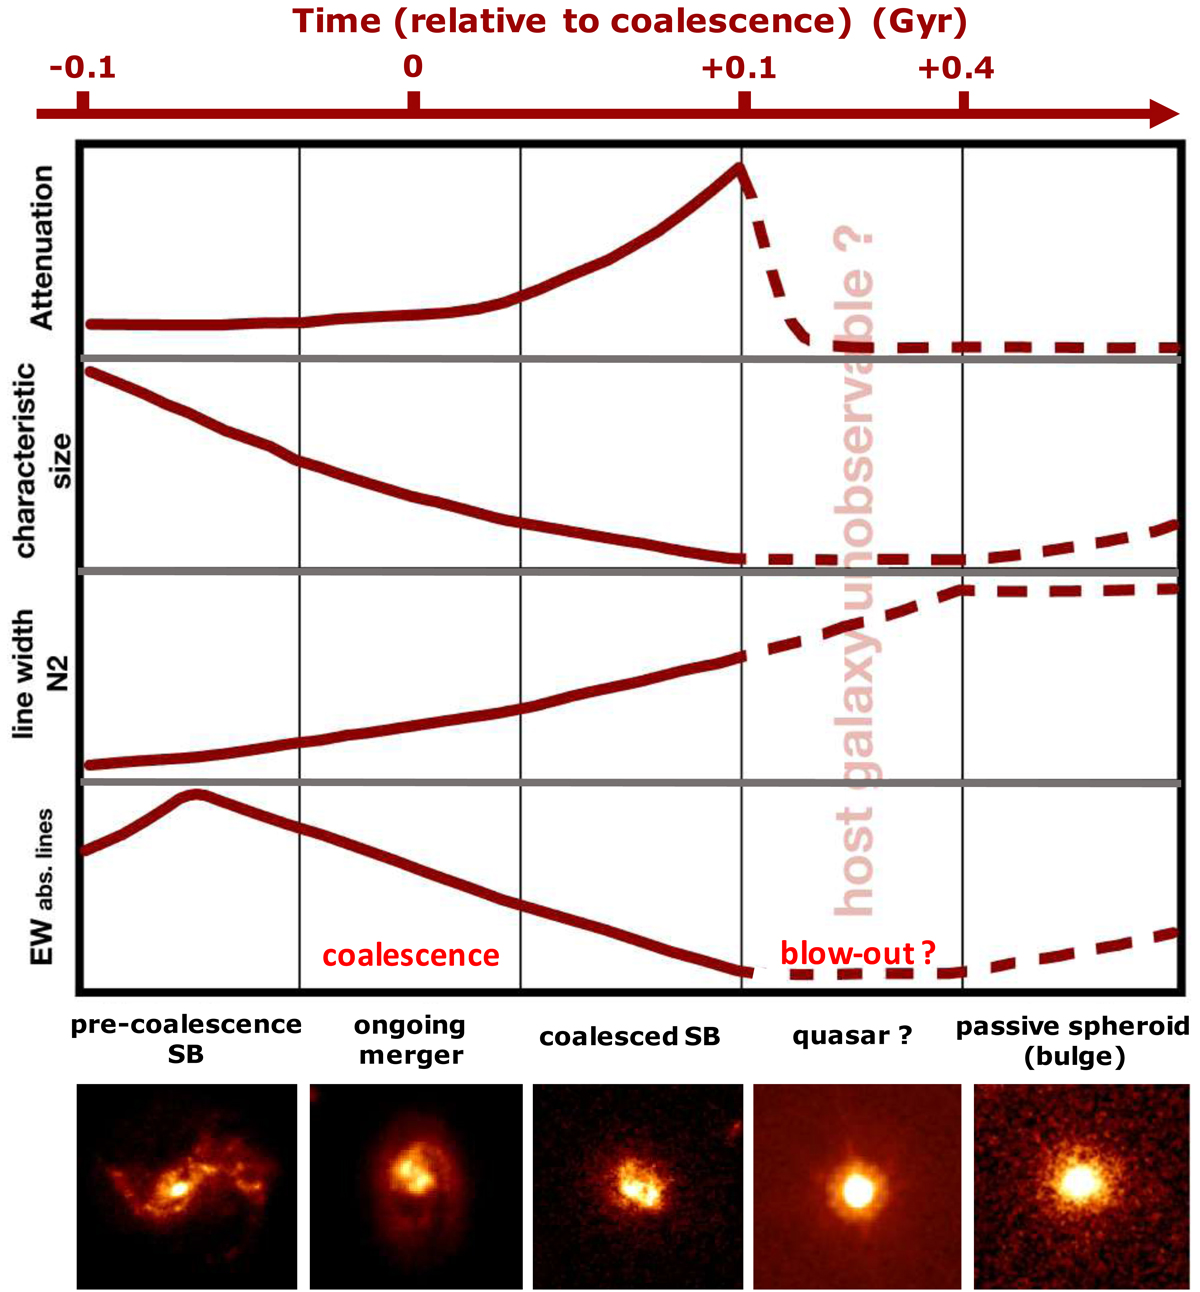
Schematic illustration of the time-evolutionary behavior of the physical parameters studied in the text: dust attenuation, characteristic size of the system, line velocity width (or, equivalently, the N2 index) and the EW of Balmer and Paschen lines. The time sequence is divided into five fundamental merger stages, with the QSO and passive spheroidal system representing the final stages according to the classical merger paradigm (Sanders & Mirabel 1996; Hopkins et al. 2008a,b). Solid lines are qualitative trends during the SB phase inferred from our results, while dashed lines are predictions for the future evolution of the four parameters shown on the y-axis (line width and N2 index behave similarly). In the upper part of the figure, we show a qualitative merger timescale following Fig. 1 of Hopkins et al. (2008b), assuming for the merger a total starburst duration of 200 Myr. For each phase, we show in the bottom part the ACS-F814W cutout of a representative case. The first three images are SB galaxies from our sample: ID 223715, ID 777034 and ID 472775. They were chosen as having increasing dust attenuations and radio compactness, suggestive of more advanced merger phases: the first was identified as a precoalescence merger in Sect. 4.1, while the latter is unresolved in radio and is highly obscured (AV, tot = 18 mag). The last two cutouts show a quasar at z = 0.73 and an ETG at z = 0.66, selected in COSMOS field from the catalogs of Prescott et al. (2006) and Tasca et al. (2009), respectively.
Current usage metrics show cumulative count of Article Views (full-text article views including HTML views, PDF and ePub downloads, according to the available data) and Abstracts Views on Vision4Press platform.
Data correspond to usage on the plateform after 2015. The current usage metrics is available 48-96 hours after online publication and is updated daily on week days.
Initial download of the metrics may take a while.