Fig. 8.
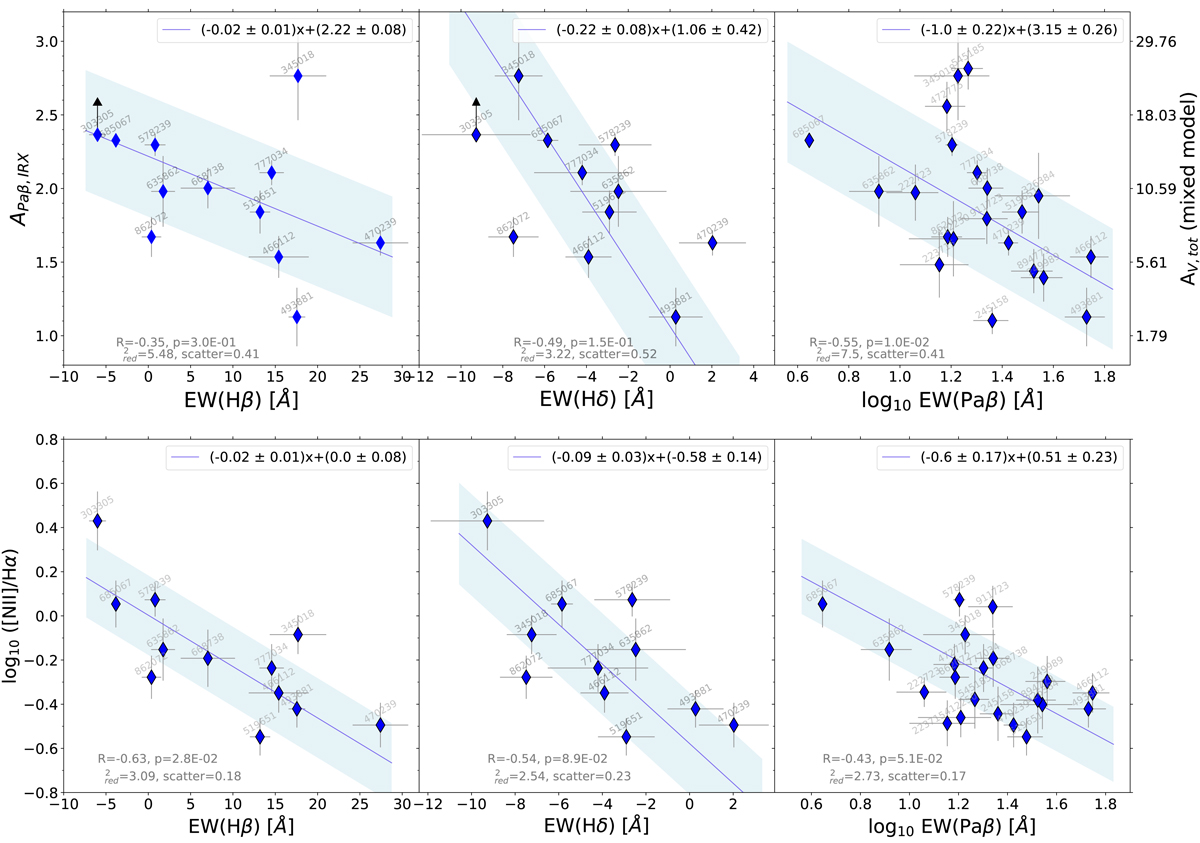
Top panels: comparison between the EW of Hδ, Hβ and Paβ lines to the dust attenuation parameter APaβ, IRX, defined as 2.5 × log10(1 + SFRIR/SFRPaβ, obs) (Paper I). We remark that the last panel is equivalent to the bottom-right plot in Fig. 3, even though a different scale has been used (the relation between APaβ, IRX and AV, tot is given in Eq. (1)). Bottom panels: correlations between the EW of Hδ, Hβ, Paβ lines and the N2 index (=log10([NII]/Hα)). The blue continuous lines are the best-fit linear relations, determined as explained in Sect. 3, while the blue shaded area show the ±1σ scatter of our data around the best-fit relations.
Current usage metrics show cumulative count of Article Views (full-text article views including HTML views, PDF and ePub downloads, according to the available data) and Abstracts Views on Vision4Press platform.
Data correspond to usage on the plateform after 2015. The current usage metrics is available 48-96 hours after online publication and is updated daily on week days.
Initial download of the metrics may take a while.