Fig. 6.
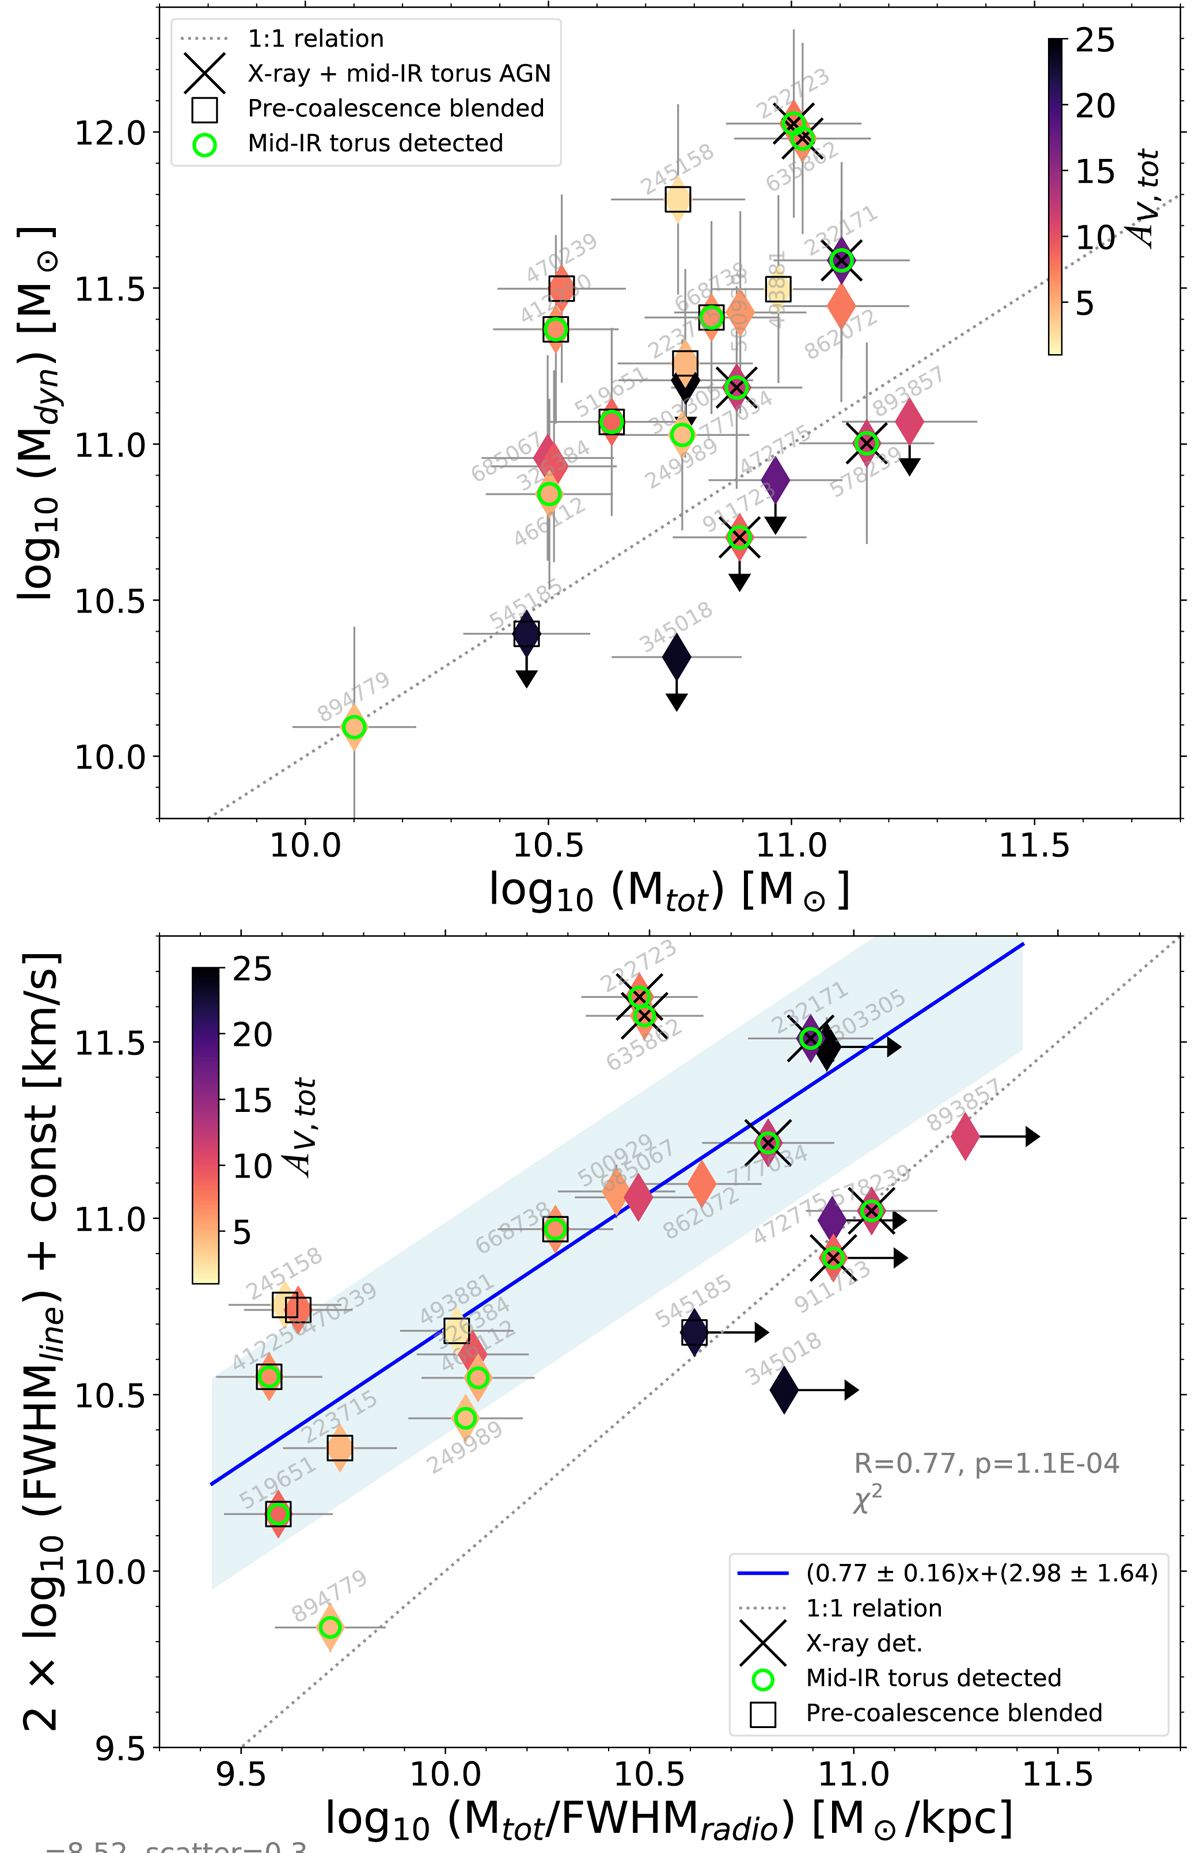
Top panel: comparison between the dynamical mass Mdyn and the total mass content Mtot (=Mgas + M* + Mdarkmatter) for our SBs sample, color coded by their total attenuation AV, tot. Bottom panel: diagram showing the square of the total FWHM velocity width as a function of Mtot/FWHMradio, using the same color coding based on AV, tot. On the y-axis, const = 1.3 × G/(4⟨sin2(i)⟩) groups the coefficients in Eq. (3) so as to facilitate comparison with the virialized case (1:1 relation, shown as a gray dotted line). The blue continuous line represents a linear fit to our sample, excluding galaxies with an upper limit on their radio size, while the blue shaded area shows the ±1σ limits of this best-fit relation. Both panels of the figure suggest that our galaxies may be approaching virialization, and more obscured starbursts are closer to the equilibrium.
Current usage metrics show cumulative count of Article Views (full-text article views including HTML views, PDF and ePub downloads, according to the available data) and Abstracts Views on Vision4Press platform.
Data correspond to usage on the plateform after 2015. The current usage metrics is available 48-96 hours after online publication and is updated daily on week days.
Initial download of the metrics may take a while.