Fig. 5.
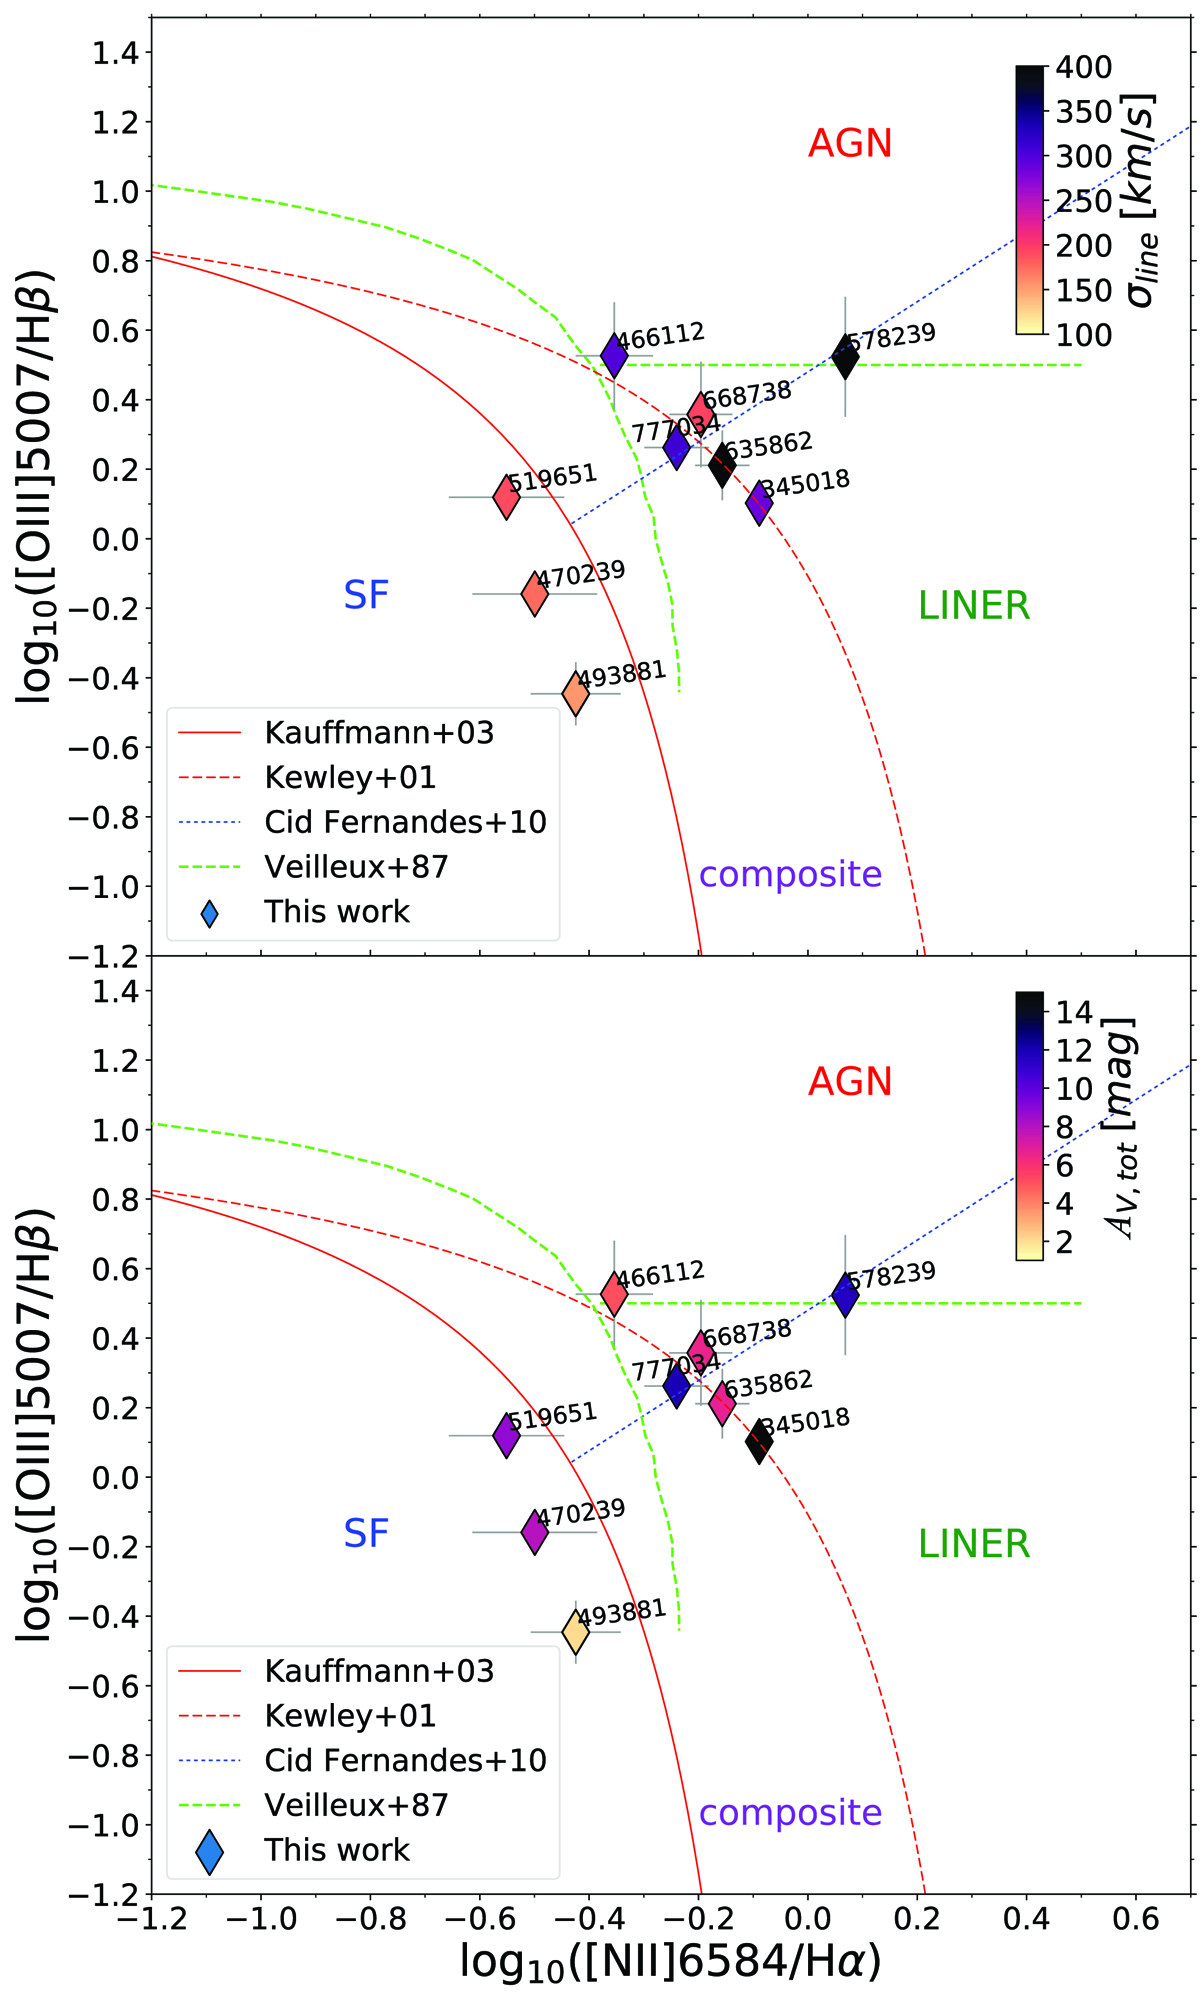
Top panel: BPT diagram of nine starbursts in our sample with optical spectra available (for one galaxy included in zCOSMOS, we did not detect both [O III]5007 and Hβ). While three sources lie in the SF excitation region, the remaining galaxies are not consistent with SF, and their spectra show a mixture of composite, AGN and LINER properties. The color coding indicates that galaxies with higher N2 which are closer to the AGN and LINER regions also have increasingly higher line velocity widths (σline). Bottom panel: same diagram as above, but here the galaxies are color coded according to their total dust attenuation AV, tot. More obscured starbursts preferentially display AGN or LINER properties.
Current usage metrics show cumulative count of Article Views (full-text article views including HTML views, PDF and ePub downloads, according to the available data) and Abstracts Views on Vision4Press platform.
Data correspond to usage on the plateform after 2015. The current usage metrics is available 48-96 hours after online publication and is updated daily on week days.
Initial download of the metrics may take a while.