Fig. 4.
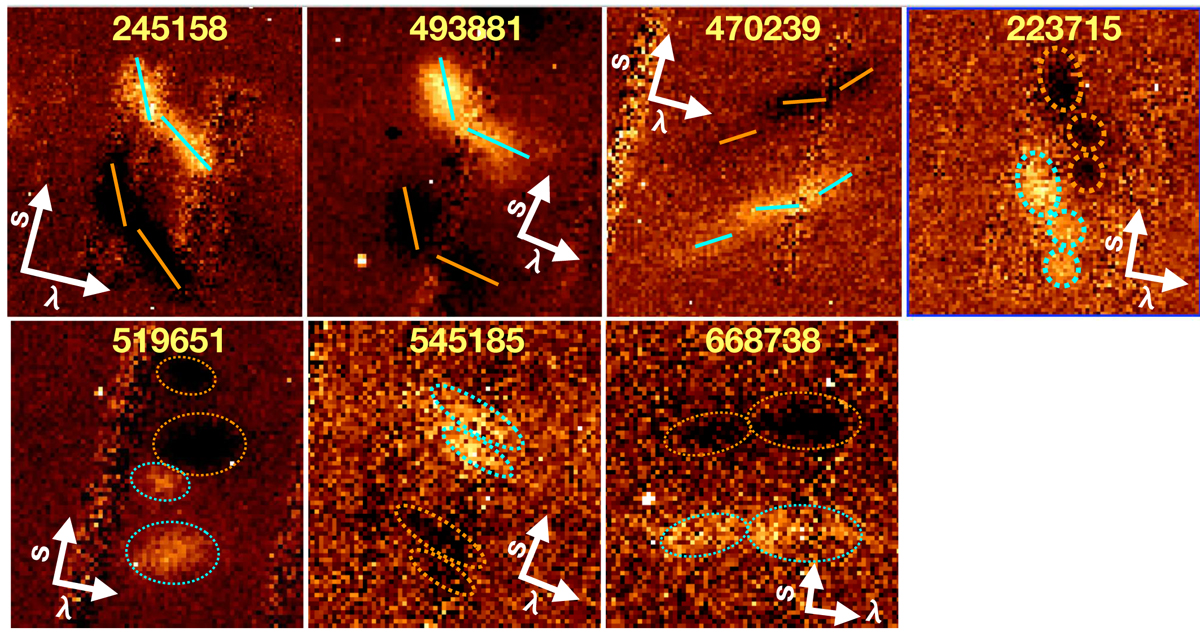
Close-up view of the Hα emission line profiles for the galaxies satisfying one of the two precoalescence criteria defined in Sect. 4.1. In each panel, as a consequence of the sky-subtraction procedure applied to the 2D spectra, the lines appear twice in different slit positions, in the first with a positive flux (in yellow) and in the second with a negative flux (in black). For each cutout, we show with two white arrows the slit position (s) and the dispersion direction (λ), which are slightly rotated due to the curved Magellan spectra. In order to clarify the classification criteria adopted in this work for finding precoalescence SBs, we highlight: (1) with continuous lines the different tilting angles of Hα line profiles (first three SBs); (2) with dotted ellipses the spatially separated Hα lines coming from different merger components (last four SBs).
Current usage metrics show cumulative count of Article Views (full-text article views including HTML views, PDF and ePub downloads, according to the available data) and Abstracts Views on Vision4Press platform.
Data correspond to usage on the plateform after 2015. The current usage metrics is available 48-96 hours after online publication and is updated daily on week days.
Initial download of the metrics may take a while.