Fig. 3.
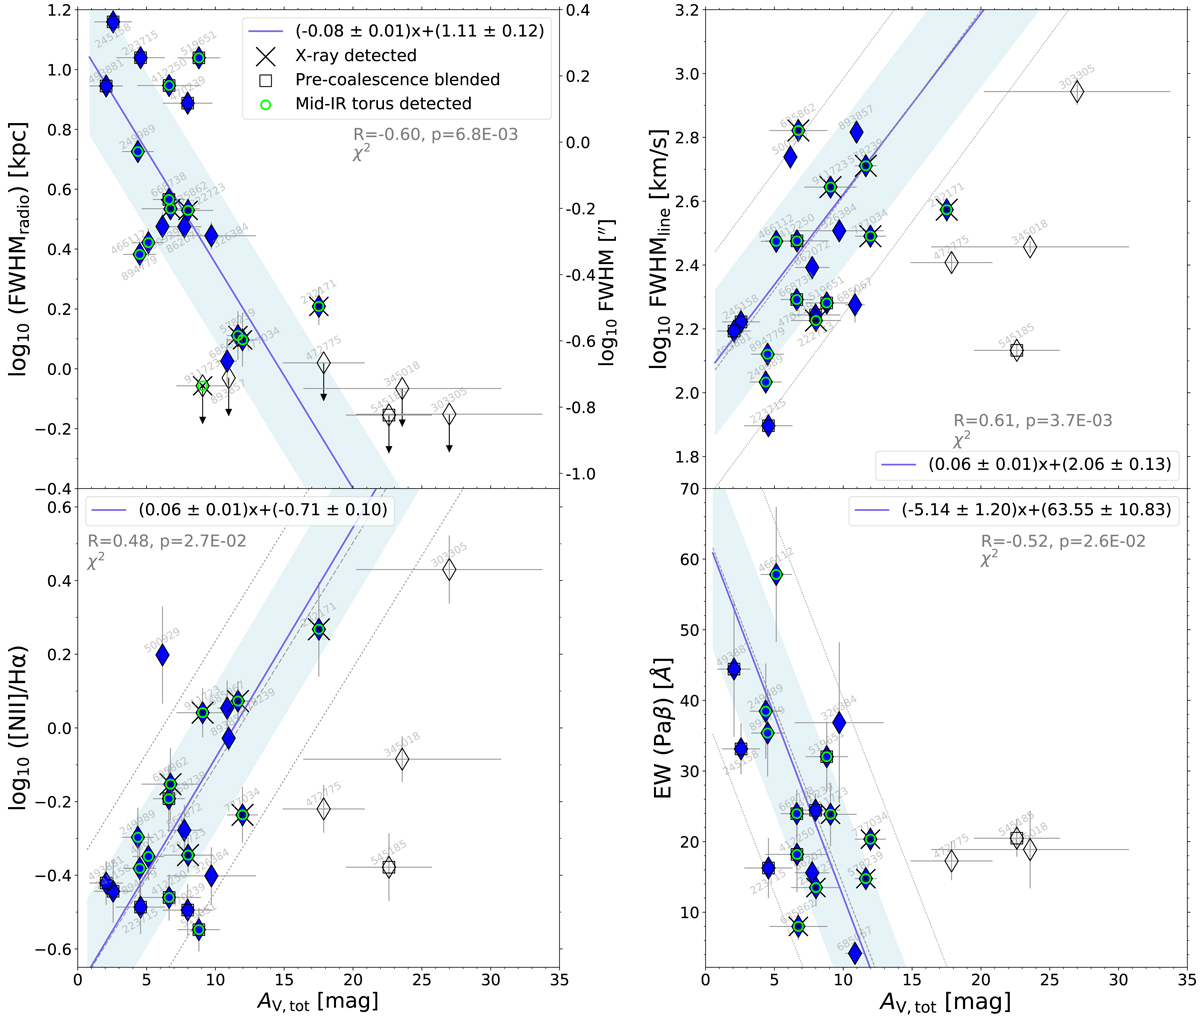
Left column: correlations of AV, tot with the radio size (top), and with the N2 index (bottom). We show with filled blue diamonds all the Magellan SBs that were used to derive the best-fit linear relation (blue continuous line) and the ±1σ dispersion (blue shaded area), while empty diamonds represent galaxies excluded from those calculations. The latter comprise the four outliers discussed in the text (ID 303305, 345018, 472775, 545185) and all the upper limits in the AV, tot vs. FWHMradio plot. In the corners, we show in black the equation of the linear fit (which includes 1σ error of the two best-fit parameters), and in gray the Spearman correlation coefficient (R) with the corresponding p-value (p), the reduced chi-square of the fit (![]() ), and the 1σ scatter of our SBs around the best-fit line, all of which do not take into account upper limits and the four outliers mentioned above. For comparison, the linear fit and 1σ dispersion including the four outlier galaxies are highlighted with a gray continuous dashed line and two dotted lines of the same color. Right column: correlations of AV, tot with the line velocity width (top), and with the EW(Paβ) (bottom). In the last diagram, four galaxies without EW(Paβ) measurements are not considered.
), and the 1σ scatter of our SBs around the best-fit line, all of which do not take into account upper limits and the four outliers mentioned above. For comparison, the linear fit and 1σ dispersion including the four outlier galaxies are highlighted with a gray continuous dashed line and two dotted lines of the same color. Right column: correlations of AV, tot with the line velocity width (top), and with the EW(Paβ) (bottom). In the last diagram, four galaxies without EW(Paβ) measurements are not considered.
Current usage metrics show cumulative count of Article Views (full-text article views including HTML views, PDF and ePub downloads, according to the available data) and Abstracts Views on Vision4Press platform.
Data correspond to usage on the plateform after 2015. The current usage metrics is available 48-96 hours after online publication and is updated daily on week days.
Initial download of the metrics may take a while.