Fig. C.1.
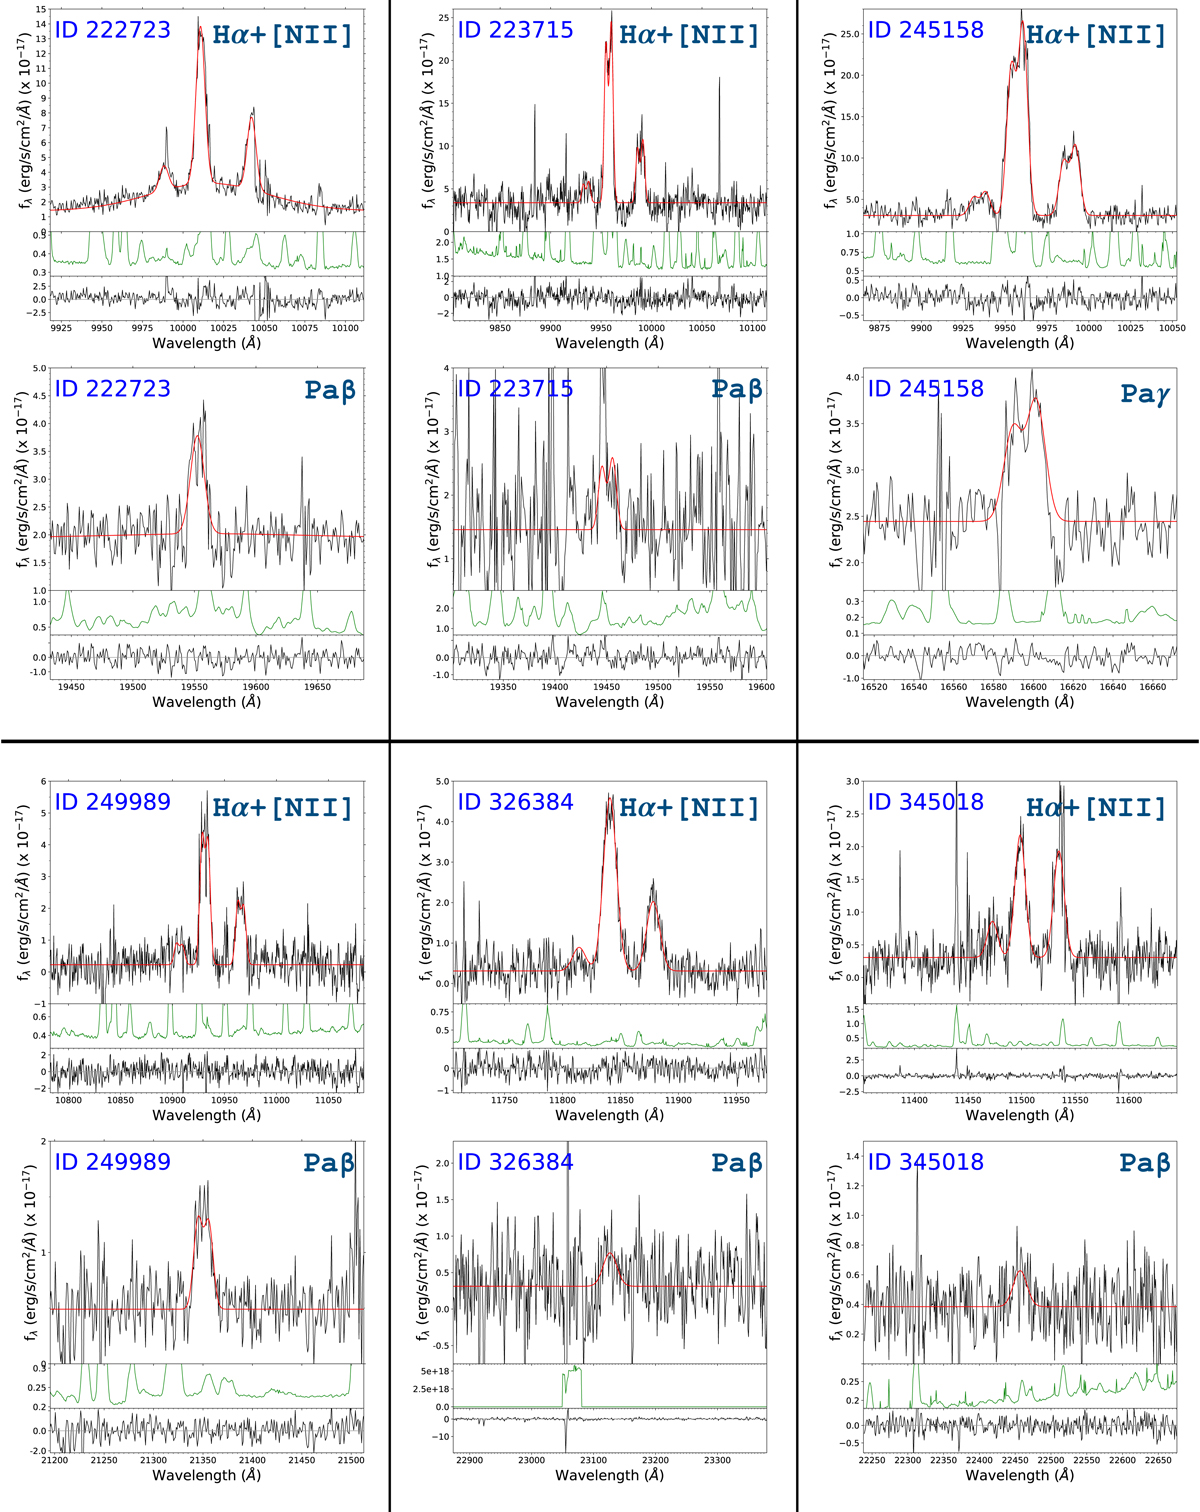
For each galaxy, in two contiguous panels (top and bottom): Hα+[N II]λ6583 Å and Paβ emission lines from the Magellan-FIRE spectrum (Paγ is shown for the galaxy ID 245158, since this line is used to infer the attenuation). Each panel is further divided into three sections: in the upper part is shown with a black line the 1D portion of the spectrum (fully calibrated) close to Hα or Paβ line, along with the best-fit Gaussian superimposed (red line). In the second part below we display the noise spectrum for the same spectral range of the object (green line), while the fit residuals (noise normalized, as described in Calabrò et al. 2018) are shown in the bottom section with a black line. The galaxies are presented in numerical order for double detections, while those with only Hα+[N II] detection are shown at the end.
Current usage metrics show cumulative count of Article Views (full-text article views including HTML views, PDF and ePub downloads, according to the available data) and Abstracts Views on Vision4Press platform.
Data correspond to usage on the plateform after 2015. The current usage metrics is available 48-96 hours after online publication and is updated daily on week days.
Initial download of the metrics may take a while.