Fig. B.3.
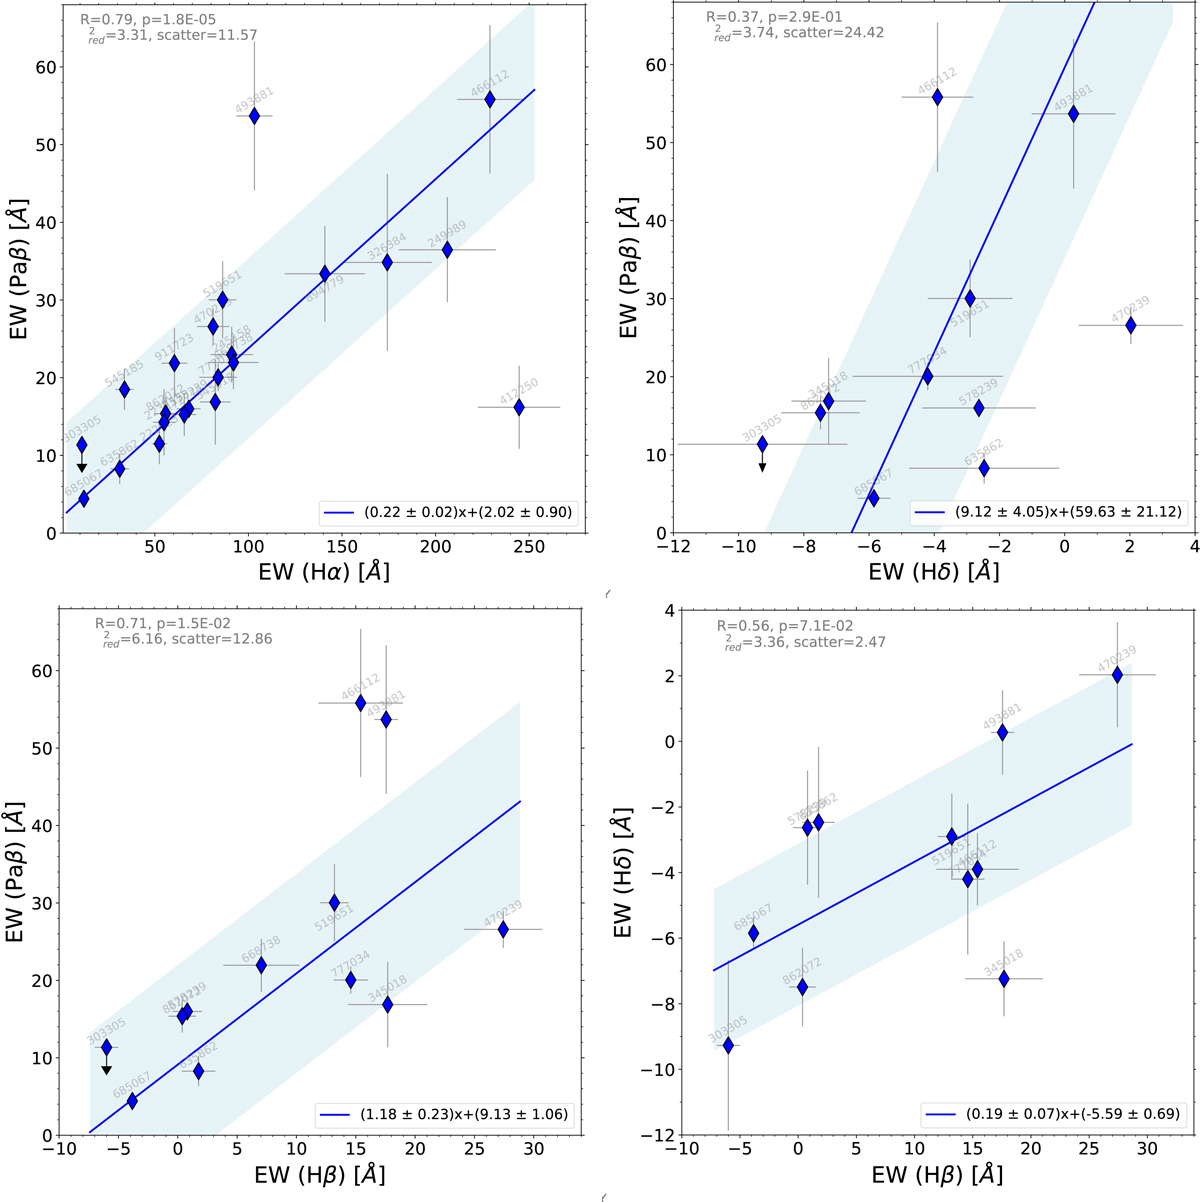
Comparison between the EWs of Hδ, Hβ, Hα and Paβ lines. The blue lines represent the best-fit linear relation, while the blue shaded areas indicate the ±1σ dispersion of the galaxies around the best-fit line. We display in top-left corner of each panel the Spearman correlation coefficient “R” and corresponding “p”-value, the residual χ2 of the correlation (“![]() ”) and the 1σ scatter around the best-fit line, whose equation (comprising 1σ errors on the best-fit coefficients) is shown in the bottom-right corner. In the four diagrams, all the points with available measurements (excluding upper limits) were used in the fit.
”) and the 1σ scatter around the best-fit line, whose equation (comprising 1σ errors on the best-fit coefficients) is shown in the bottom-right corner. In the four diagrams, all the points with available measurements (excluding upper limits) were used in the fit.
Current usage metrics show cumulative count of Article Views (full-text article views including HTML views, PDF and ePub downloads, according to the available data) and Abstracts Views on Vision4Press platform.
Data correspond to usage on the plateform after 2015. The current usage metrics is available 48-96 hours after online publication and is updated daily on week days.
Initial download of the metrics may take a while.