Fig. B.2.
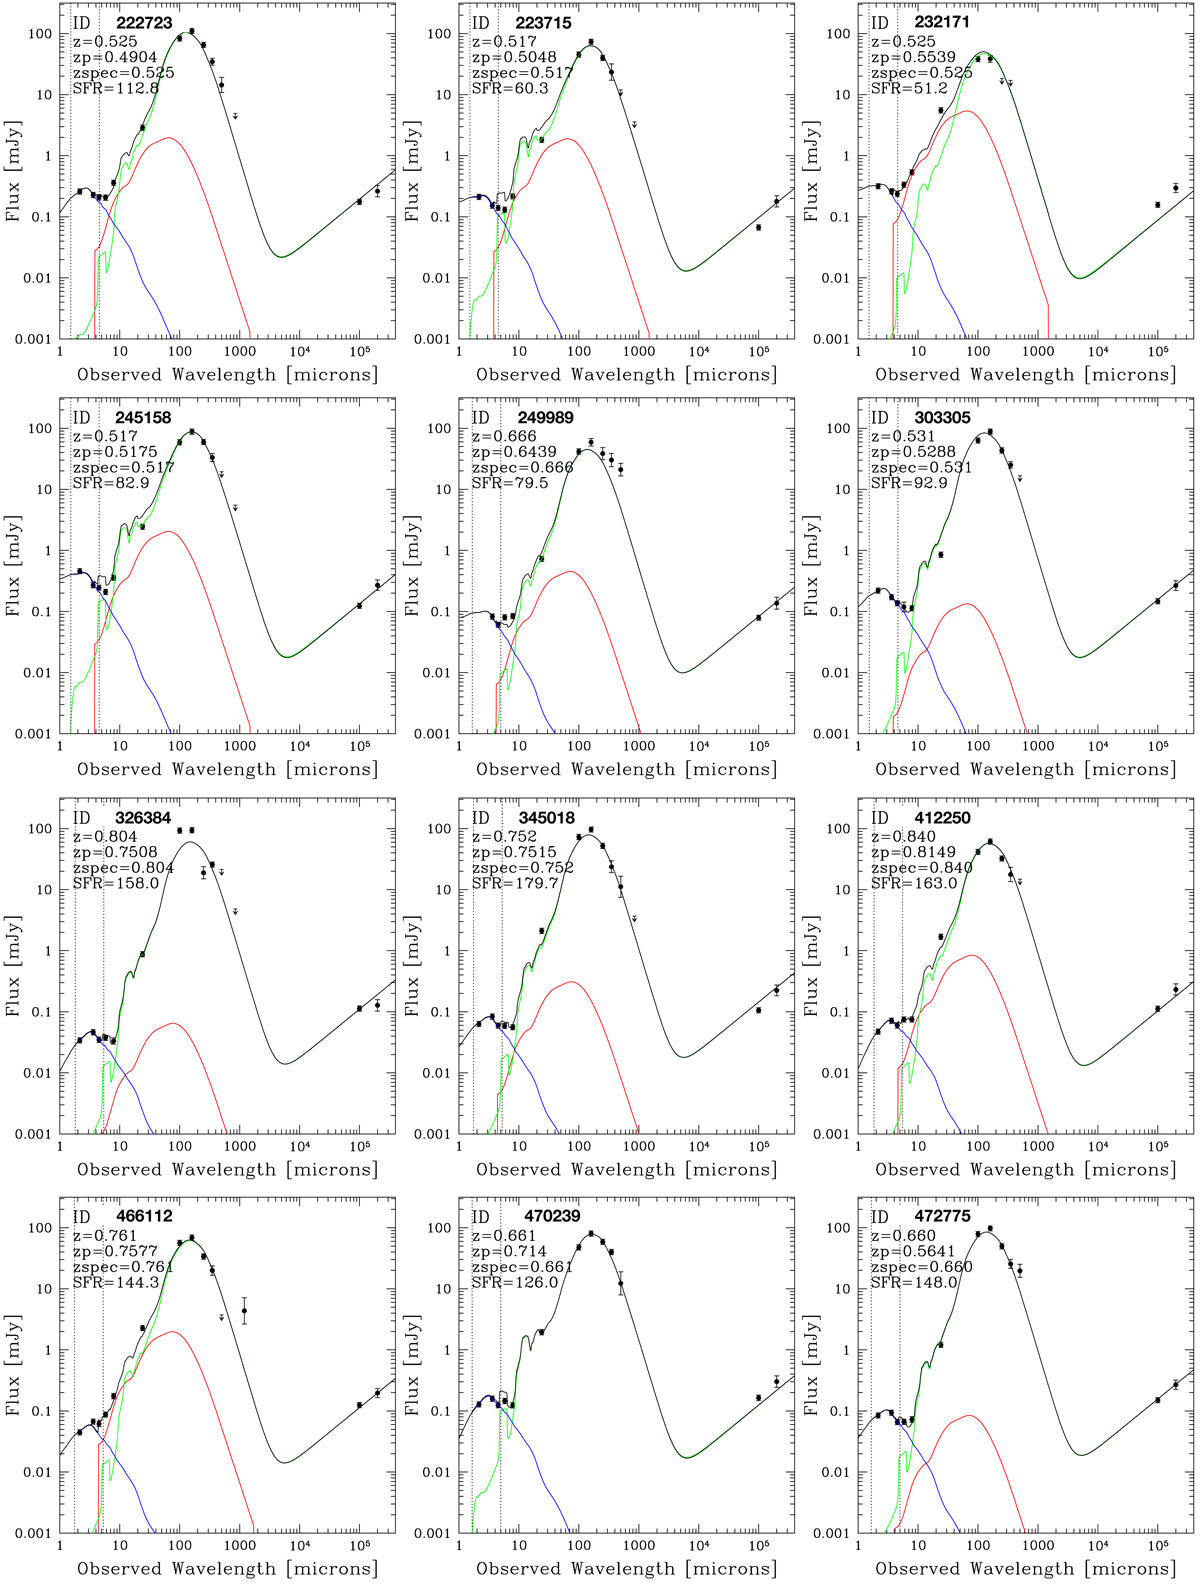
SED fitting of the 25 starburst galaxies studied in this paper, presented in numerical order. The SED fitting procedure is described in Sect. 2.1. Blue and red curves show the stellar component (Bruzual & Charlot 2003) and the AGN torus emission (Mullaney et al. 2011), while the dust continuum emission is shown in green (Magdis et al. 2012). Downward arrows show the 2σ upper limit photometry at given wavelength. In each panel, zspec is the spectroscopic redshift from our Magellan spectra, zphot is the photometric redshift from Laigle et al. (2016), z is the output redshift of the best-fit SED (which in our cases was fixed to the spectroscopic value), and SFR is the best-fit infrared star-formation rate. The vertical dotted lines indicates the optimized range for fitting the stellar SED only (in order to avoid contamination from AGN torus and dust emission). The rightmost line also indicates the starting wavelength for fitting the AGN + dust SED in our paper. We remind the reader that the radio photometry (at 1.4 and 3 GHz) was not used in the fit, as explained in Sect. 2.1.
Current usage metrics show cumulative count of Article Views (full-text article views including HTML views, PDF and ePub downloads, according to the available data) and Abstracts Views on Vision4Press platform.
Data correspond to usage on the plateform after 2015. The current usage metrics is available 48-96 hours after online publication and is updated daily on week days.
Initial download of the metrics may take a while.