Fig. B.1.
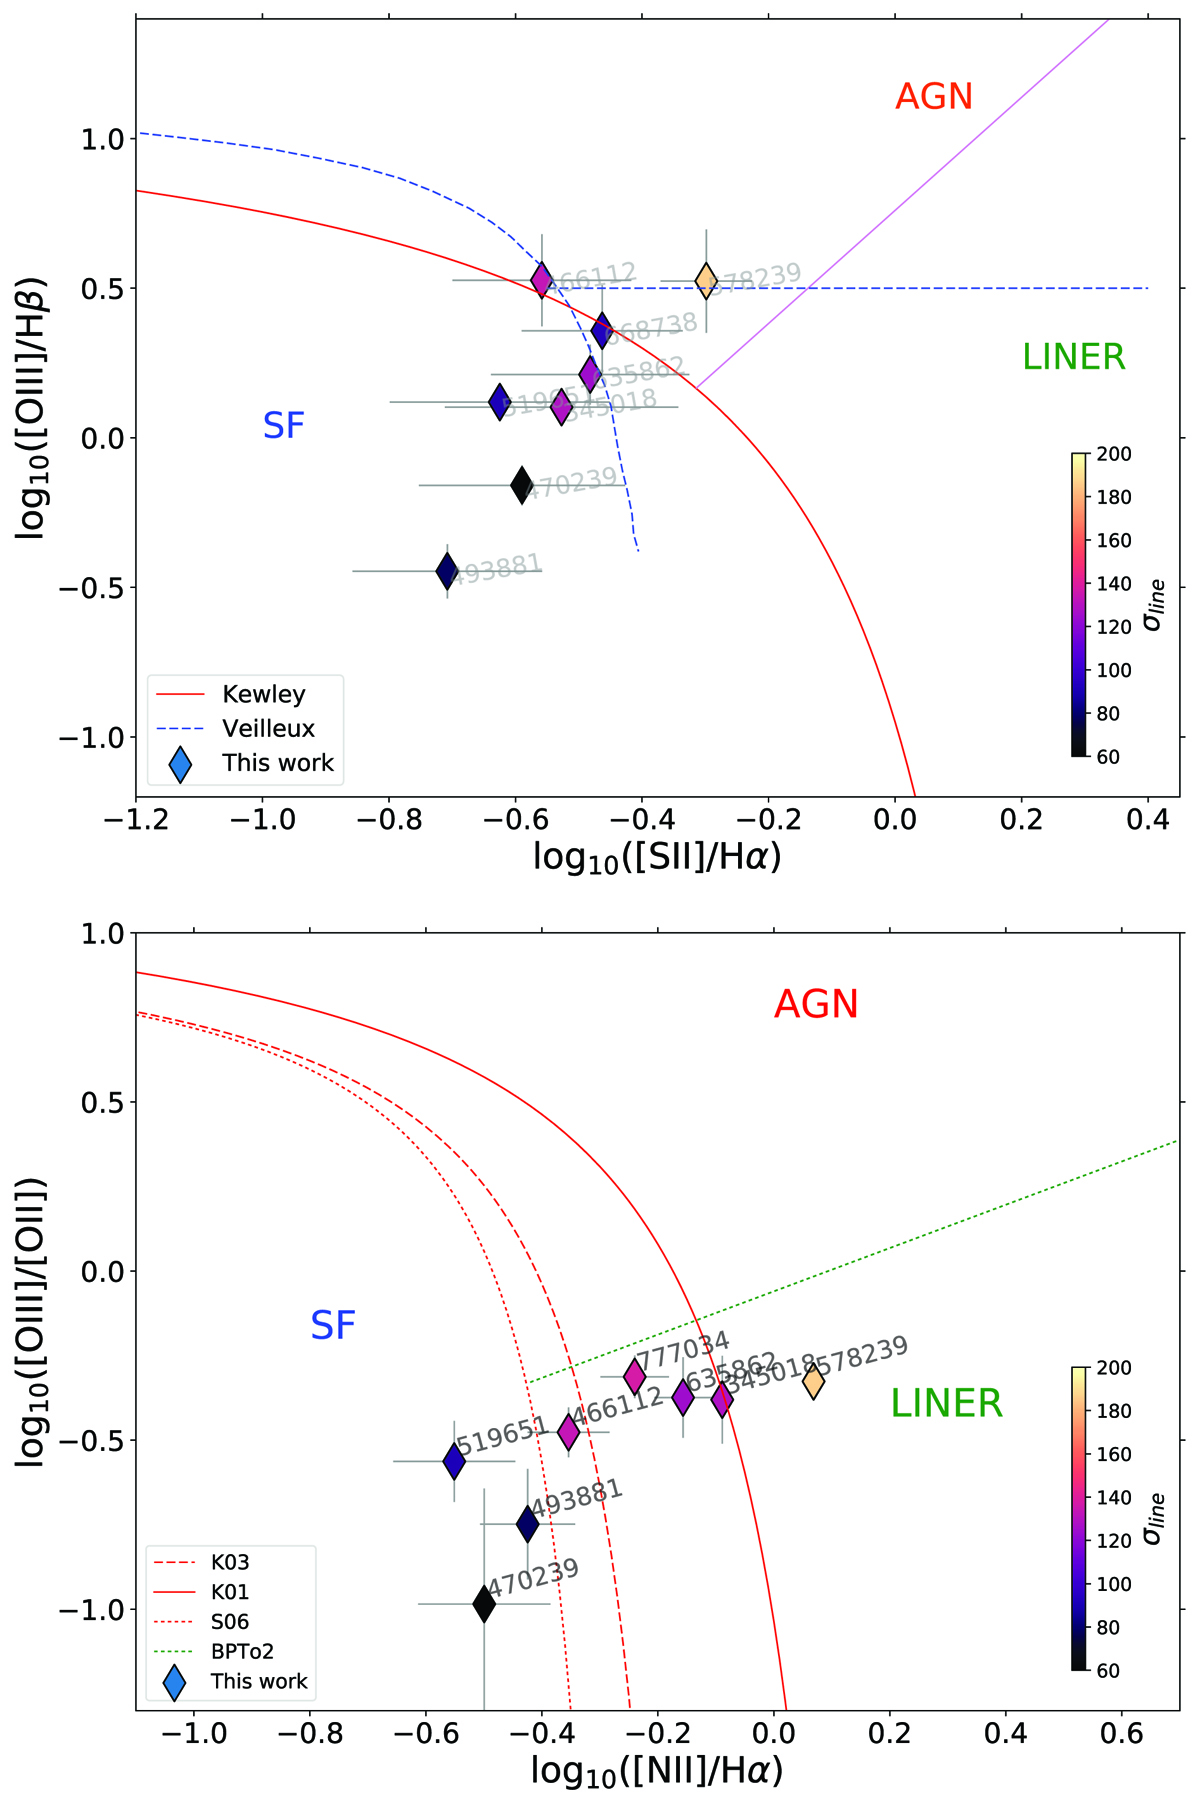
Diagram of [O III]/Hβ compared to [S II]6717+6731/Hα (top) and [O III]5007/[O II]3727+3729 vs. [N II]6583/Hα (bottom) for 8 galaxies of our sample with optical spectra available and contemporary detection of [O III] and one between [S II]+Hβ or [O II]. The two diagrams are also called the S2 and the O2 BPT diagrams, respectively. As in the classical BPT diagram in Fig. 5, they show that our starbursts have different line excitation properties, and those with higher line velocity widths are generally shifted toward the AGN and LINER regions, according to empirical separation lines derived in the local (z ≲ 0.3) Universe.
Current usage metrics show cumulative count of Article Views (full-text article views including HTML views, PDF and ePub downloads, according to the available data) and Abstracts Views on Vision4Press platform.
Data correspond to usage on the plateform after 2015. The current usage metrics is available 48-96 hours after online publication and is updated daily on week days.
Initial download of the metrics may take a while.