Fig. 12.
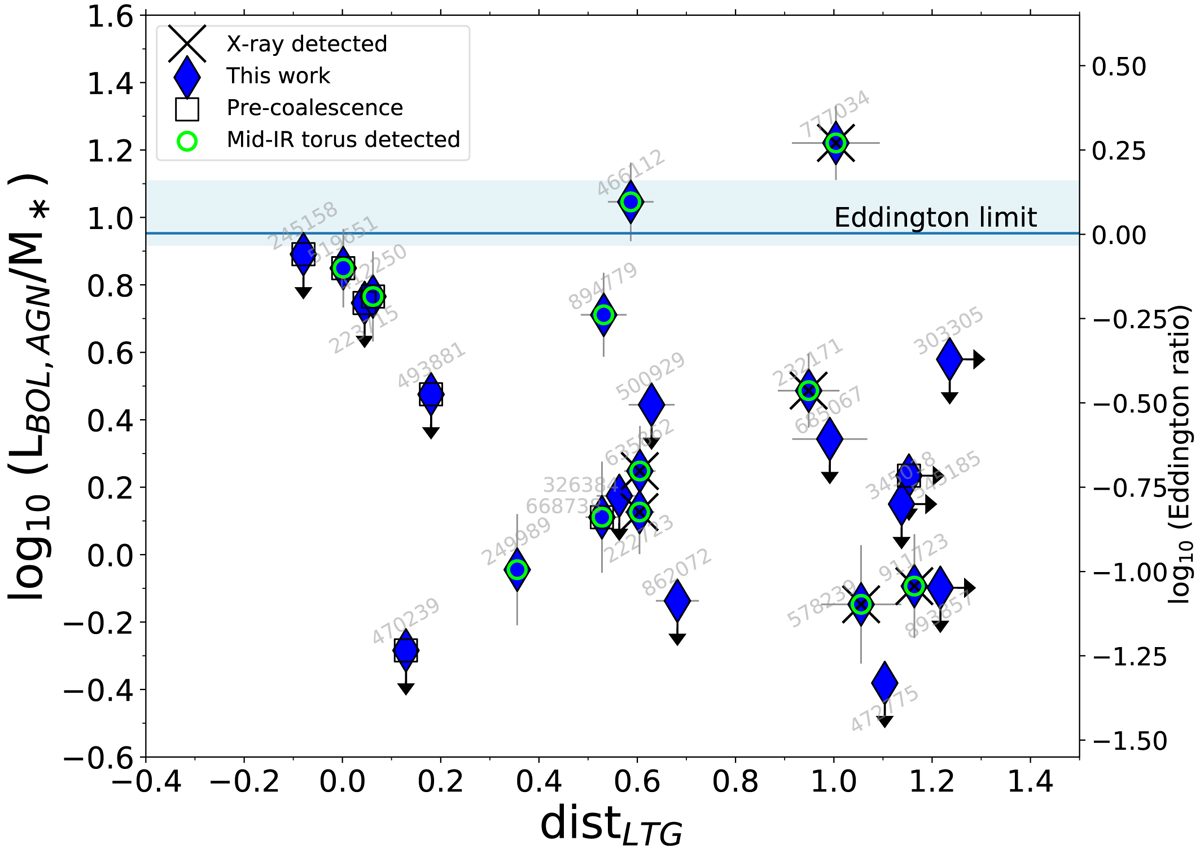
LBOL, AGN/M* vs. distance from the mass-size relation of LTGs (distLTG) for our SBs sample. The Eddington limit is shown with a blue horizontal line, while the shaded area takes into account the spread of M* among our sample and the uncertainty of the relation between stellar mass and BH mass by Reines & Volonteri (2015). The Eddington ratio is shown on the right y-axis.
Current usage metrics show cumulative count of Article Views (full-text article views including HTML views, PDF and ePub downloads, according to the available data) and Abstracts Views on Vision4Press platform.
Data correspond to usage on the plateform after 2015. The current usage metrics is available 48-96 hours after online publication and is updated daily on week days.
Initial download of the metrics may take a while.