Fig. 11.
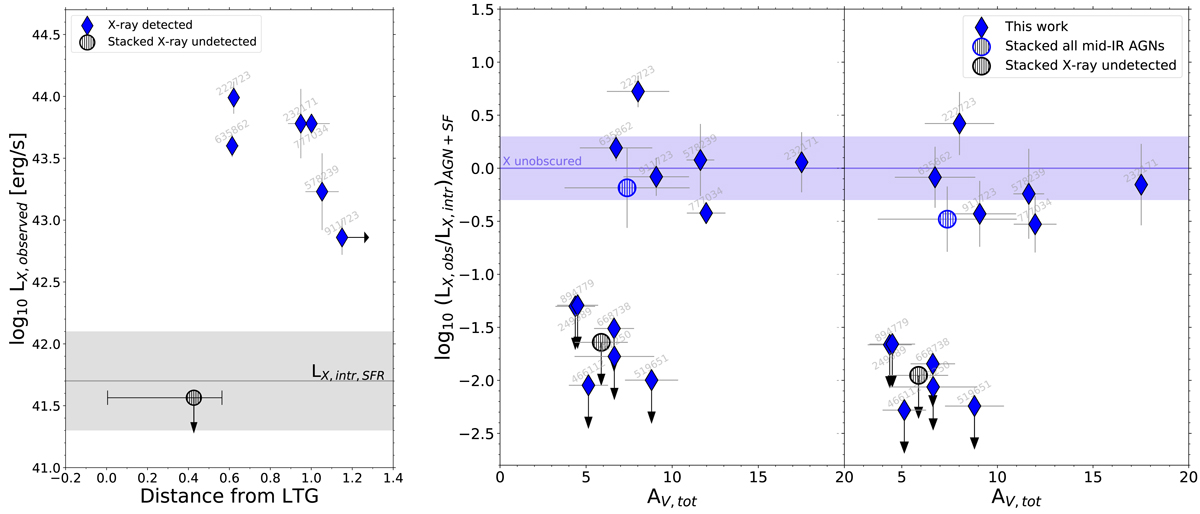
Left panel: comparison between the observed X-ray luminosity (LX, obs) and the distance from the mass-size relation of LTGs at z ∼ 0.7, for our six starbursts detected in X-rays. Upper limit on LX, obs for six mid-IR AGNs undetected in X is shown with a black circle, where the horizontal segment represents the range of distLTG spanned by this subset. The intrinsic X-ray luminosity due to star-formation is highlighted with a gray line for the median SFR of the sample (±0.4 dex scatter from Mineo et al. 2014), and may dominate the total X-ray observed emission for the X-undetected starbursts. Center panel: X-ray attenuation LX, obs/LX, int as a function of the infrared-based attenuation AV, tot (in a mixed model geometry and toward the center) for our sample of mid-IR detected AGNs. We assumed here a bolometric correction factor LX, intr, AGN = 0.04 × LBOL, AGN (Vasudevan & Fabian 2007). Stacks on the whole sample and on the X-undetected subset are displayed with hatching circles, while the violet shaded regions indicate the area of no obscuration, which incorporates a factor of two uncertainty in the conversion between intrinsic X-ray and bolometric AGN luminosity. Right panel: same diagram as before, but assuming an LBOL, AGN- dependent bolometric correction (Lusso et al. 2012), as explained in the text.
Current usage metrics show cumulative count of Article Views (full-text article views including HTML views, PDF and ePub downloads, according to the available data) and Abstracts Views on Vision4Press platform.
Data correspond to usage on the plateform after 2015. The current usage metrics is available 48-96 hours after online publication and is updated daily on week days.
Initial download of the metrics may take a while.