Fig. 10.
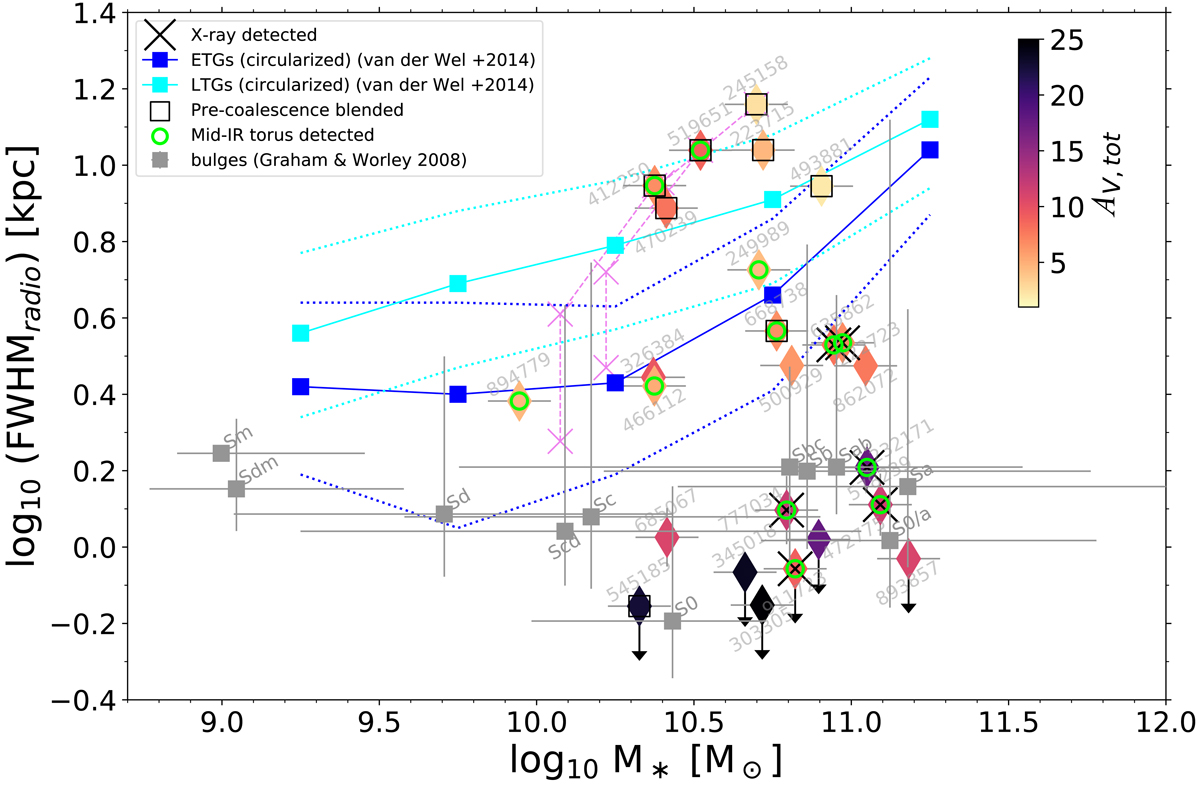
Diagram showing the radio size vs. stellar mass for our sample. We compare our results to the stellar mass–stellar size relation of LTGs (cyan line with 1σ dispersion) and ETGs (blue line) at z = 0.7 (van der Wel et al. 2014), and with the bulge properties of low redshift (z ∼ 0.1) spiral galaxies from Graham & Worley (2008; gray squares). The eleven points shown here for the bulges represent the median (±1σ) of their distributions of stellar masses and stellar sizes (in K band) as a function of galaxy type, from S0 to Sm spirals. For three galaxies in our sample fit with a double Gaussian, we also represent the “deblended” radio sizes of each single component with violet crosses, connecting them with a dashed violet line. In these cases, we assigned to each component half of the total stellar mass of the system, even though a precise estimation requires a separate fit on deblended photometric data.
Current usage metrics show cumulative count of Article Views (full-text article views including HTML views, PDF and ePub downloads, according to the available data) and Abstracts Views on Vision4Press platform.
Data correspond to usage on the plateform after 2015. The current usage metrics is available 48-96 hours after online publication and is updated daily on week days.
Initial download of the metrics may take a while.