Fig. 2.
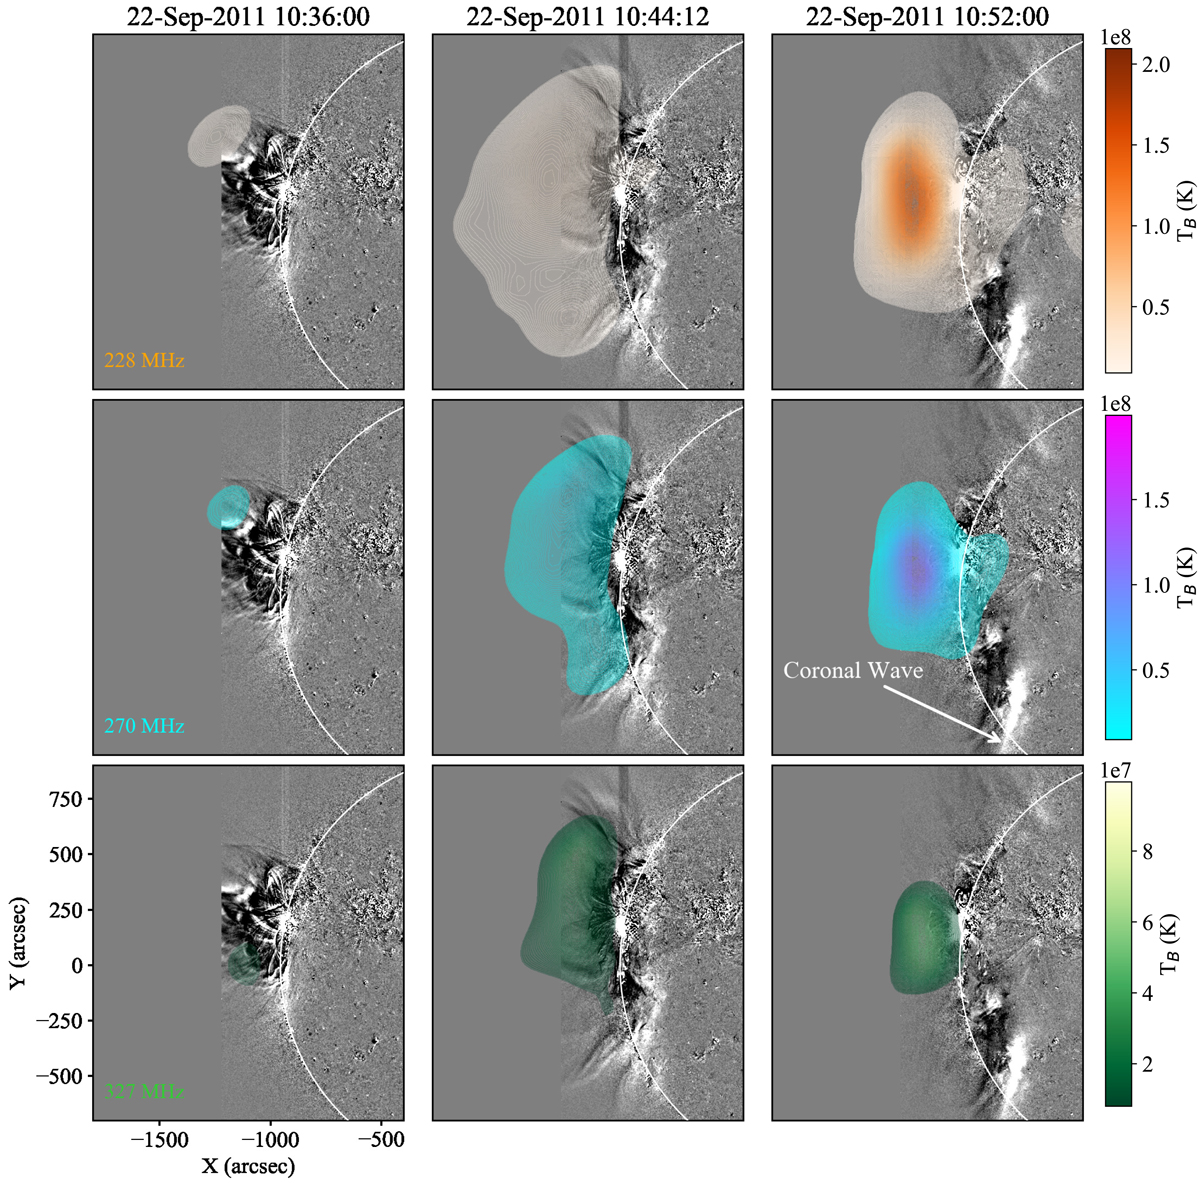
Radio source locations observed by NRH associated with the 22 September 2011 CME. The radio sources (filled contours) are overlaid on AIA 211 Å running-difference images. The radio sources are shown from top to bottom at three different frequencies of 228, 270, and 327 MHz and from left to right at three different times of 10:36, 10:44, and 10:52 UT. The sources in the middle panels are very large. The movie accompanying this paper shows the full evolution in time of these radio sources.
Current usage metrics show cumulative count of Article Views (full-text article views including HTML views, PDF and ePub downloads, according to the available data) and Abstracts Views on Vision4Press platform.
Data correspond to usage on the plateform after 2015. The current usage metrics is available 48-96 hours after online publication and is updated daily on week days.
Initial download of the metrics may take a while.