Open Access
Fig. 5.
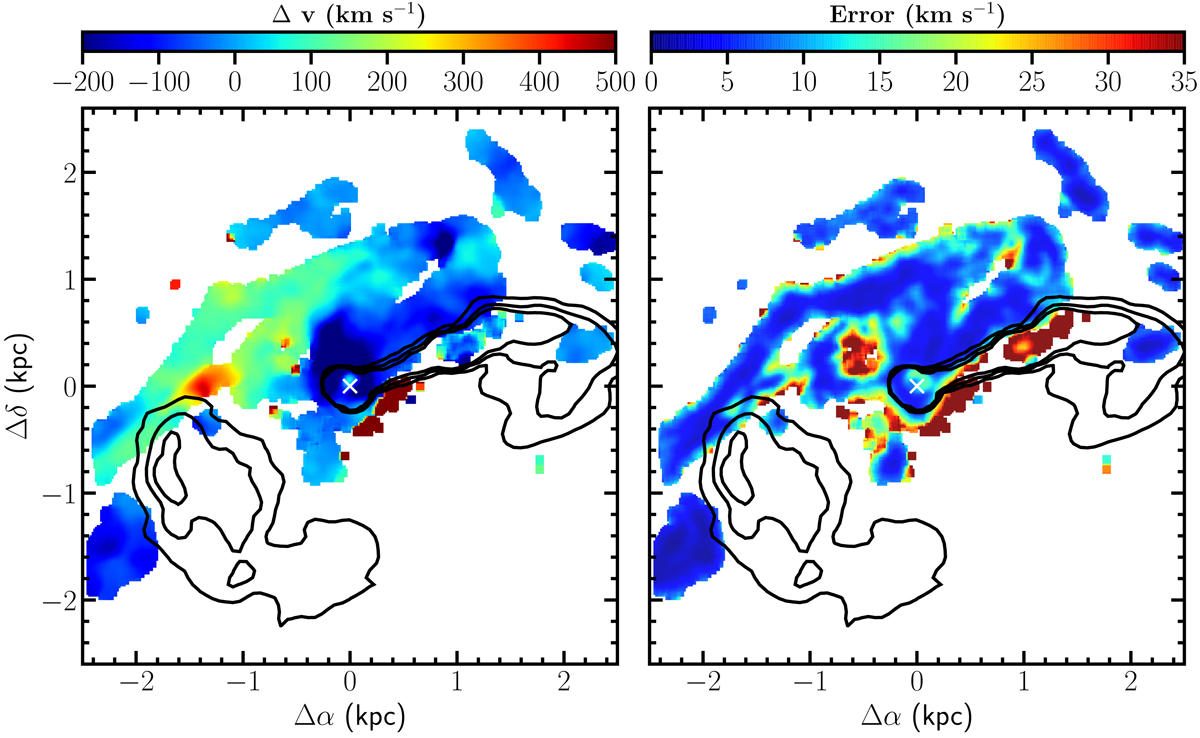
Velocity map (left panel) and associated error (right panel) of the ionised gas derived from MUSE for emission lines with a S/N > 10. The velocity of the gas is given relative to the systemic velocity of the galaxy of 1292 km s−1.
Current usage metrics show cumulative count of Article Views (full-text article views including HTML views, PDF and ePub downloads, according to the available data) and Abstracts Views on Vision4Press platform.
Data correspond to usage on the plateform after 2015. The current usage metrics is available 48-96 hours after online publication and is updated daily on week days.
Initial download of the metrics may take a while.