Open Access
Fig. 3.
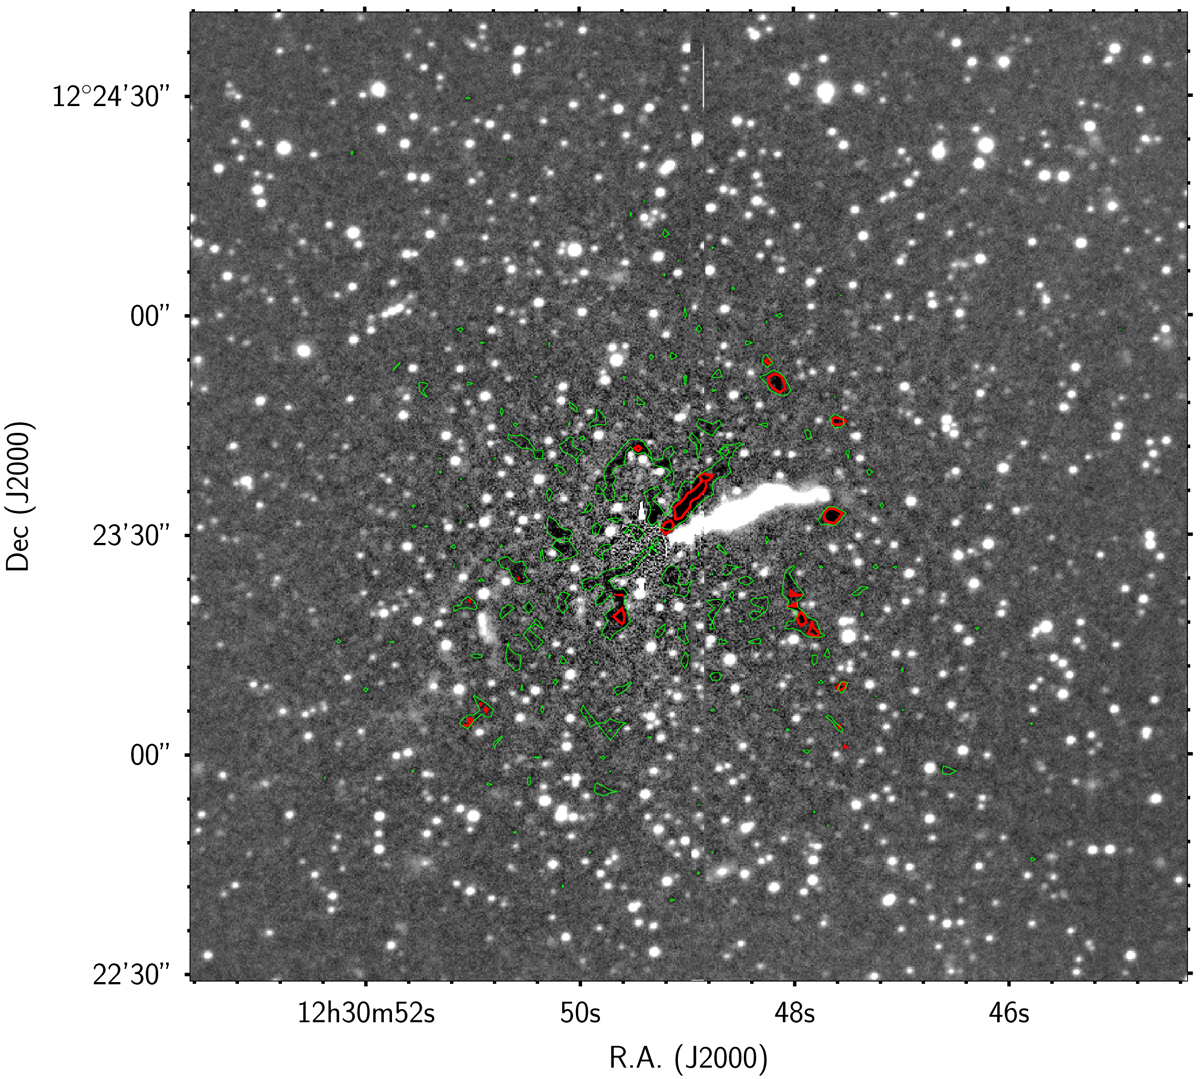
Stellar continuum subtracted g-band image of M 87. The dark regions outlined by green contours are dusty structures detected in absorption. The red contour corresponds to Ag = 0.010 ± 0.002. The bright elongated region is the jet and the point sources globular clusters and foreground stars.
Current usage metrics show cumulative count of Article Views (full-text article views including HTML views, PDF and ePub downloads, according to the available data) and Abstracts Views on Vision4Press platform.
Data correspond to usage on the plateform after 2015. The current usage metrics is available 48-96 hours after online publication and is updated daily on week days.
Initial download of the metrics may take a while.