Open Access
Fig. 2.
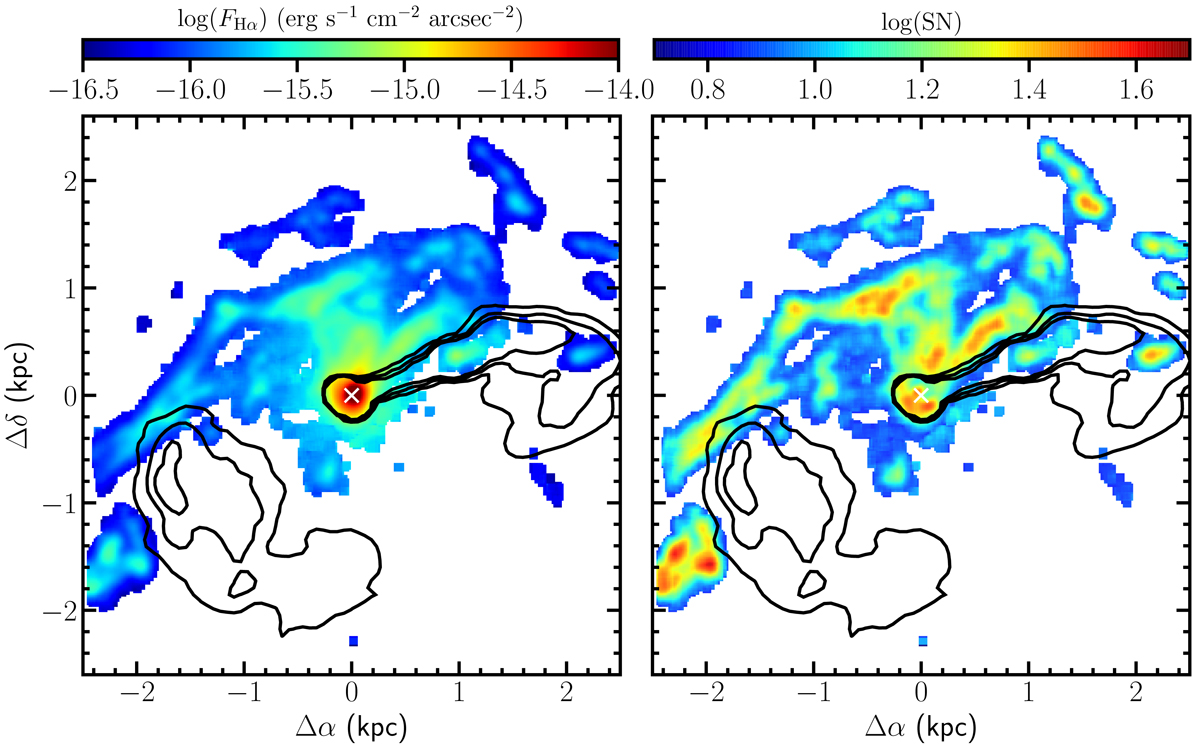
The Hα emission line map (left panel) and its S/N (right panel) of the ionised gas derived from MUSE for a S/N > 5. The white cross in the centre of the frame indicates the position of the nucleus. The contour levels indicate the jet and counter-jet determined from 115 GHz ALMA data.
Current usage metrics show cumulative count of Article Views (full-text article views including HTML views, PDF and ePub downloads, according to the available data) and Abstracts Views on Vision4Press platform.
Data correspond to usage on the plateform after 2015. The current usage metrics is available 48-96 hours after online publication and is updated daily on week days.
Initial download of the metrics may take a while.