Fig. B.1.
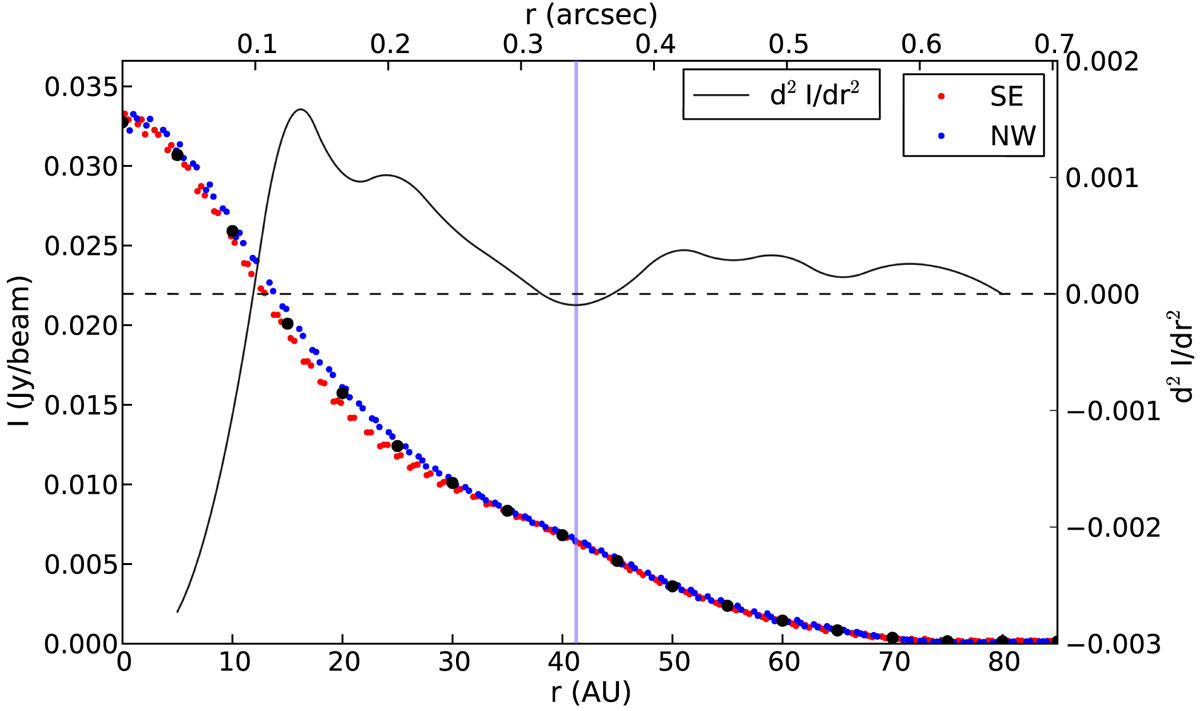
Radial cut of the continuum intensity map of DG Tau at 1.3 mm: every point corresponds to a pixel inside a half-beam across the disk major axis (i = 41°, PA = 128°). Red dots represent the southeast side of the disk, blue dots the northwest side. The large black dots correspond to 5 au bins computed by averaging the two sides. The black curve is the second derivative of the continuum intensity profile. The solid vertical line indicates the center of the continuum enhancement, at 41 au.
Current usage metrics show cumulative count of Article Views (full-text article views including HTML views, PDF and ePub downloads, according to the available data) and Abstracts Views on Vision4Press platform.
Data correspond to usage on the plateform after 2015. The current usage metrics is available 48-96 hours after online publication and is updated daily on week days.
Initial download of the metrics may take a while.