Fig. A.1.
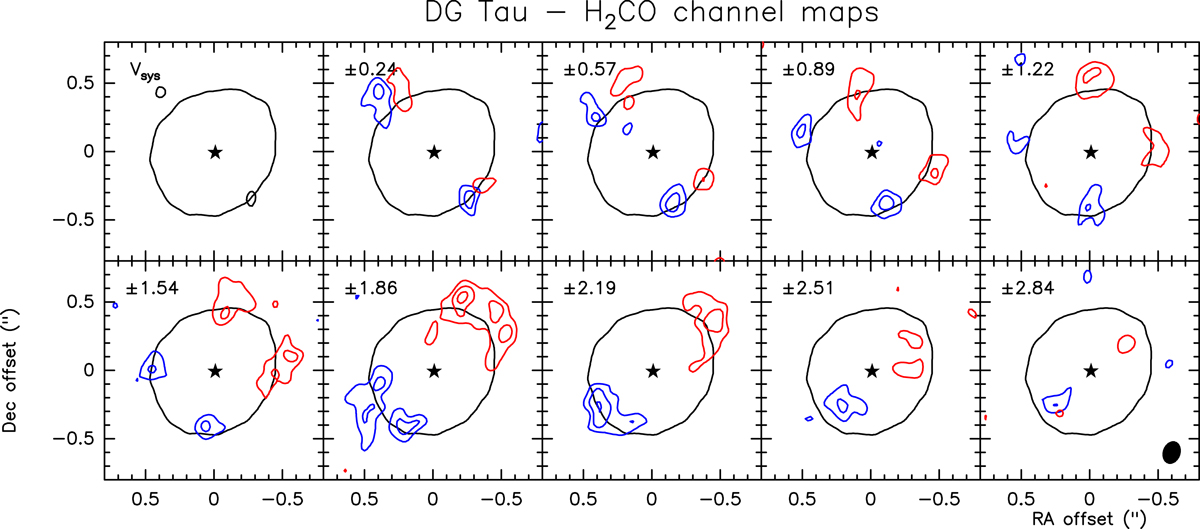
Channel maps of H2CO 312 − 211 towards DG Tau. The blue and red contours show the emission at symmetric blue- and redshifted velocities with respect to systemic (Vsys = +6.24 km s−1), as labeled in the upper right corner (V − Vsys in km s−1). The first contour is at 5σ with steps of 3σ. The black star and contour indicates the peak and the 5σ level of the 1.3 mm continuum. The ellipse in the bottom right corner of the last channel map shows the ALMA synthesized beam.
Current usage metrics show cumulative count of Article Views (full-text article views including HTML views, PDF and ePub downloads, according to the available data) and Abstracts Views on Vision4Press platform.
Data correspond to usage on the plateform after 2015. The current usage metrics is available 48-96 hours after online publication and is updated daily on week days.
Initial download of the metrics may take a while.