Fig. 2.
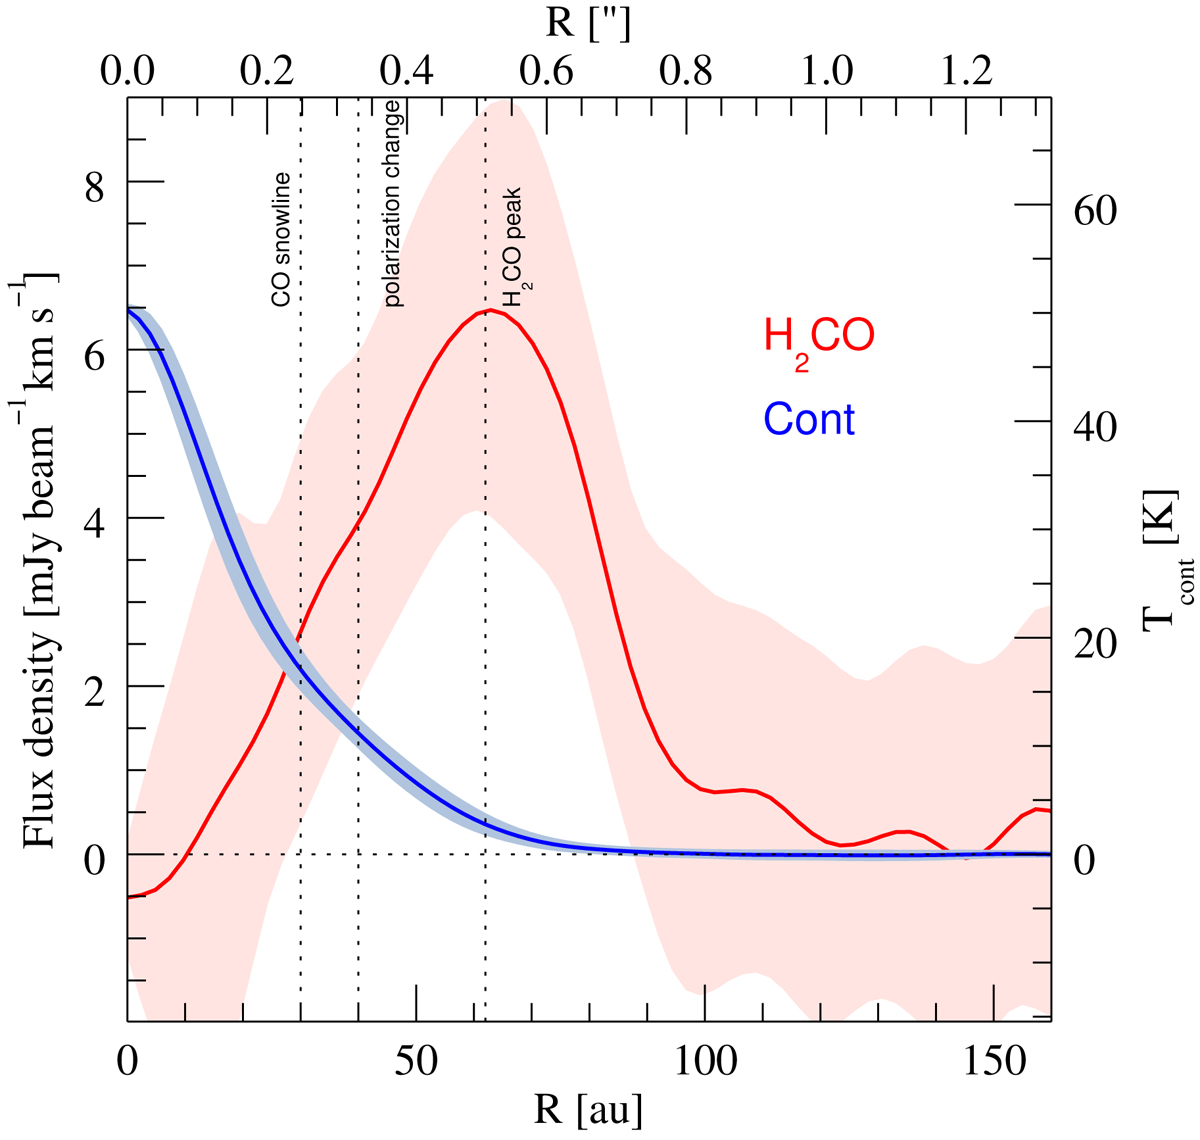
Azimuthally averaged radial intensity profile of H2CO 31, 2 − 21, 1 (in mJy beam−1 km s−1, red line) and of the 1.3 mm continuum (in K, blue line). For the continuum the conversion factor from brightness temperature to flux density is 0.65 mJy beam−1 K−1. The shaded areas indicate the dispersion of the intensity values around the mean along each annulus in the radial direction. The vertical black dotted lines indicate the position of the CO iceline, the change in the polarization orientation, and the H2CO emission peak.
Current usage metrics show cumulative count of Article Views (full-text article views including HTML views, PDF and ePub downloads, according to the available data) and Abstracts Views on Vision4Press platform.
Data correspond to usage on the plateform after 2015. The current usage metrics is available 48-96 hours after online publication and is updated daily on week days.
Initial download of the metrics may take a while.