Fig. 1.
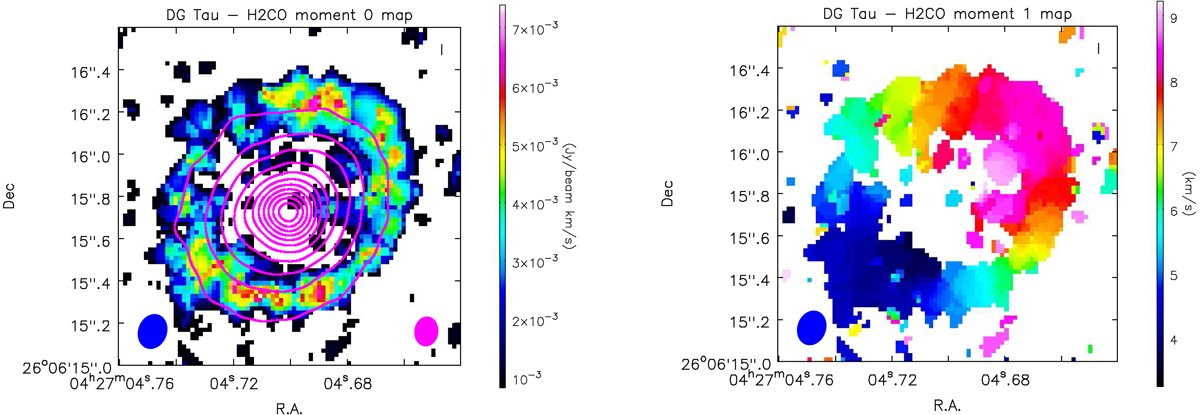
Moment maps of H2CO towards DG Tau. Left panel: H2CO moment 0 map. The color scale indicates the line intensity integrated over the H2CO velocity profile (VLSR = ( + 3.24, +9.24) km s−1) in Jy beam−1 km s−1. The magenta contours indicate the 1.3 mm dust continuum emission (from 3σ with steps of 10σ). The blue and magenta ellipse in the bottom left and right corner indicate the synthesized beam for H2CO and the continuum, respectively. Right panel: H2CO moment 1 map. The color scale indicates the velocity VLSR in km s−1.
Current usage metrics show cumulative count of Article Views (full-text article views including HTML views, PDF and ePub downloads, according to the available data) and Abstracts Views on Vision4Press platform.
Data correspond to usage on the plateform after 2015. The current usage metrics is available 48-96 hours after online publication and is updated daily on week days.
Initial download of the metrics may take a while.