Fig. 6
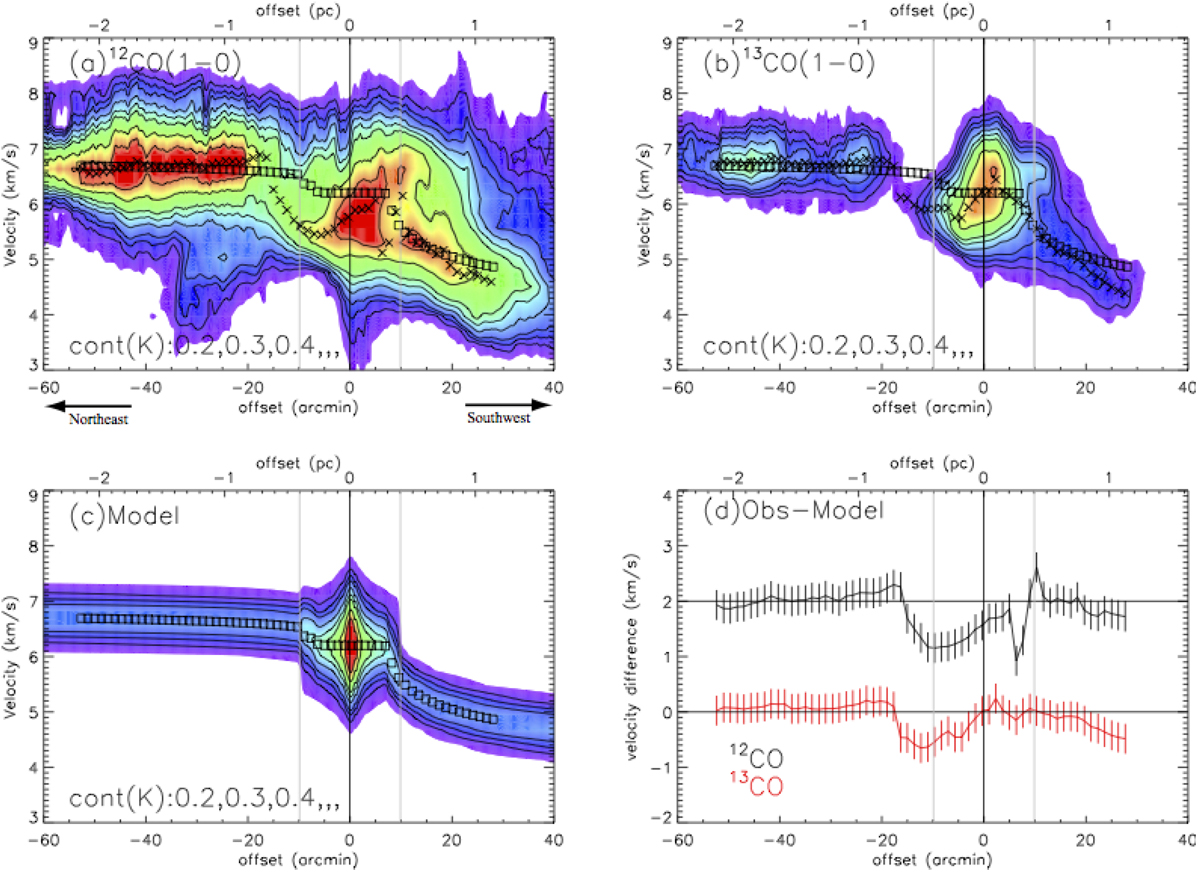
Position–velocity diagram of 12CO (1–0) (panel a), 13CO (1–0) (panel b), and the model (panel c) and velocity (panel d) offsets between 12 CO (1–0) and 13CO (1–0) observations and model. The assumed parameters for the accretion model are summarized in Table 1. The cut line of the PV diagrams is indicated in Fig 1. In panels a–c, black squares indicate the peak velocity positions at each offset. In panels a and b, black crosses are the peak velocity positions at each offset in the model. In panel d, lines indicate the velocity offset (black) between 12 CO (1–0) and the model and (red) between 13CO (1–0) and the model. In panels a–d, black and gray vertical lines indicate offset = 0′ and |offset| < Rout.
Current usage metrics show cumulative count of Article Views (full-text article views including HTML views, PDF and ePub downloads, according to the available data) and Abstracts Views on Vision4Press platform.
Data correspond to usage on the plateform after 2015. The current usage metrics is available 48-96 hours after online publication and is updated daily on week days.
Initial download of the metrics may take a while.