Open Access
Fig. A.6
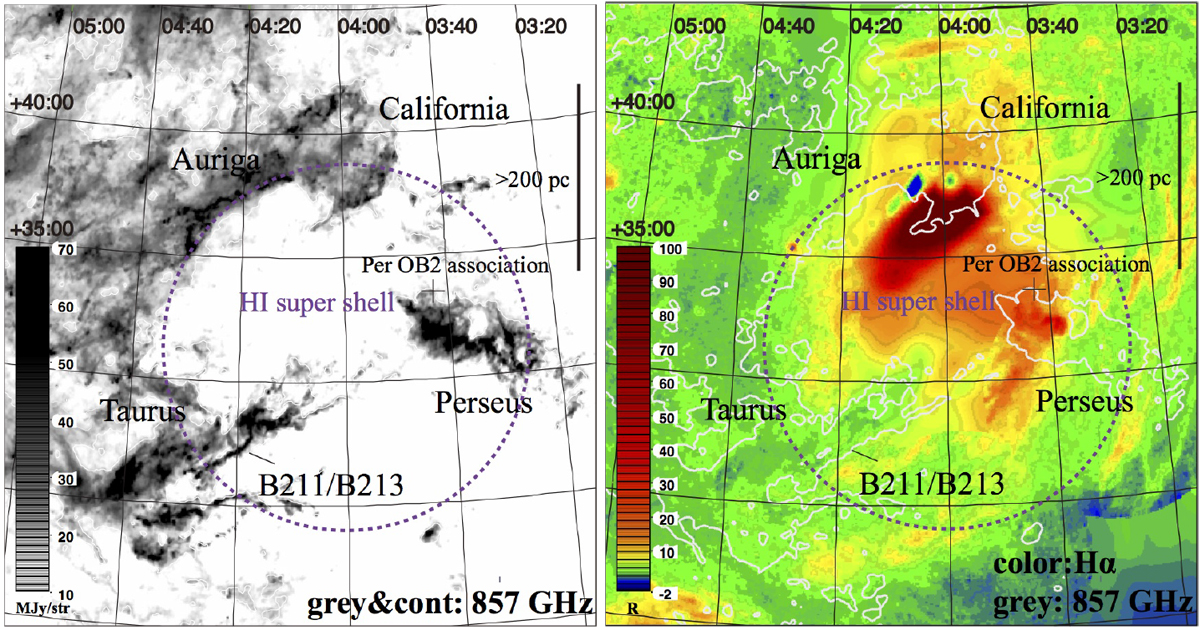
Spatial distributions of the Hα (color; left panel; Finkbeiner 2003) and 857 GHz dust (gray; right panel; Planck Collaboration I 2014) emission. Same as Fig. 10, but the Hα and Planck 857 GHz maps are displayed separately for clarity. The contour indicates a level of 10 MJy str−1 at the Planck 857 GHz emission.
Current usage metrics show cumulative count of Article Views (full-text article views including HTML views, PDF and ePub downloads, according to the available data) and Abstracts Views on Vision4Press platform.
Data correspond to usage on the plateform after 2015. The current usage metrics is available 48-96 hours after online publication and is updated daily on week days.
Initial download of the metrics may take a while.