Open Access
Fig. A.5
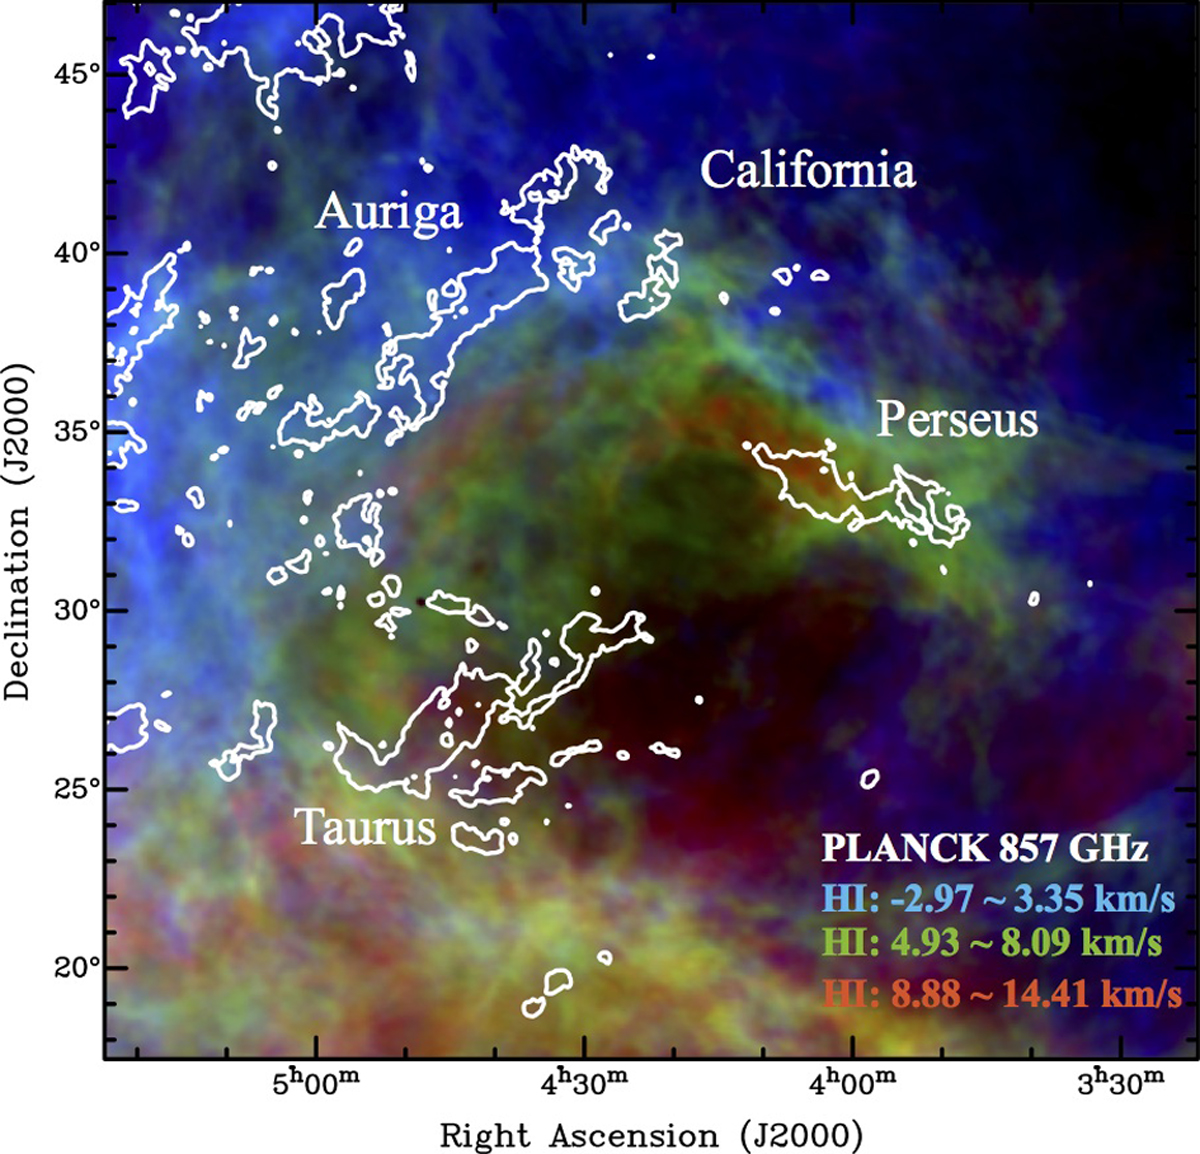
Large-scale spatial distribution of HI emission in the Taurus–Auriga–California–Perseus region from Kalberla et al. (2017). Red, green, and blue are the HI components at the velocity of −29.7 to 3.35, 4.93–8.09, and 8.88–14.41 km s−1. The contour indicates a level of 30 MJy str−1 at the Planck 857 GHz emission.
Current usage metrics show cumulative count of Article Views (full-text article views including HTML views, PDF and ePub downloads, according to the available data) and Abstracts Views on Vision4Press platform.
Data correspond to usage on the plateform after 2015. The current usage metrics is available 48-96 hours after online publication and is updated daily on week days.
Initial download of the metrics may take a while.