Fig. 1
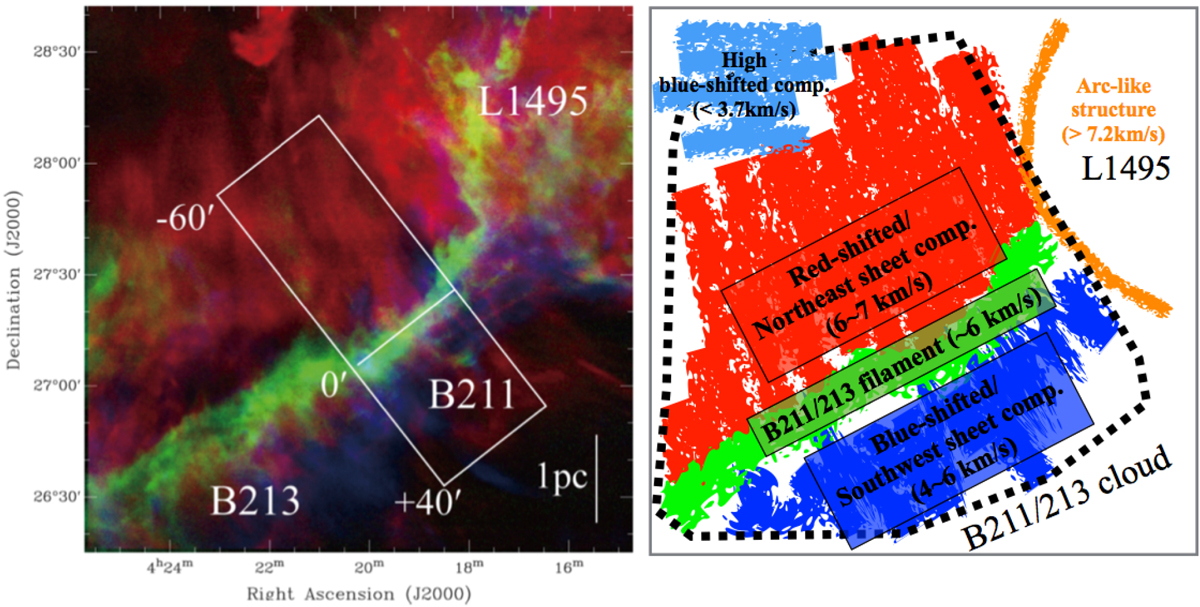
Left panel: 12CO (1–0) and 13CO (1–0) emission observed toward the B211/B213 filament. Right panel: schematic picture of the velocity components. The 12 CO and 13 CO data are from Goldsmith et al. (2008). The left panel is adopted from Palmeirim et al. (2013). In the left panel the red color shows the distribution of the 12 CO (1–0) emission with a velocity range of 6.6–7.4 km s−1, the green color shows 13CO (1–0) emission with a velocity range of 5.6–6.4 km s−1, and the blue color shows 12CO (1–0) emission with a velocity range of 4.2–5.5 km s−1. The white box perpendicular to the filament axis shows the cut line for the position velocity diagrams shown in Fig. 6.
Current usage metrics show cumulative count of Article Views (full-text article views including HTML views, PDF and ePub downloads, according to the available data) and Abstracts Views on Vision4Press platform.
Data correspond to usage on the plateform after 2015. The current usage metrics is available 48-96 hours after online publication and is updated daily on week days.
Initial download of the metrics may take a while.