Fig. 7.
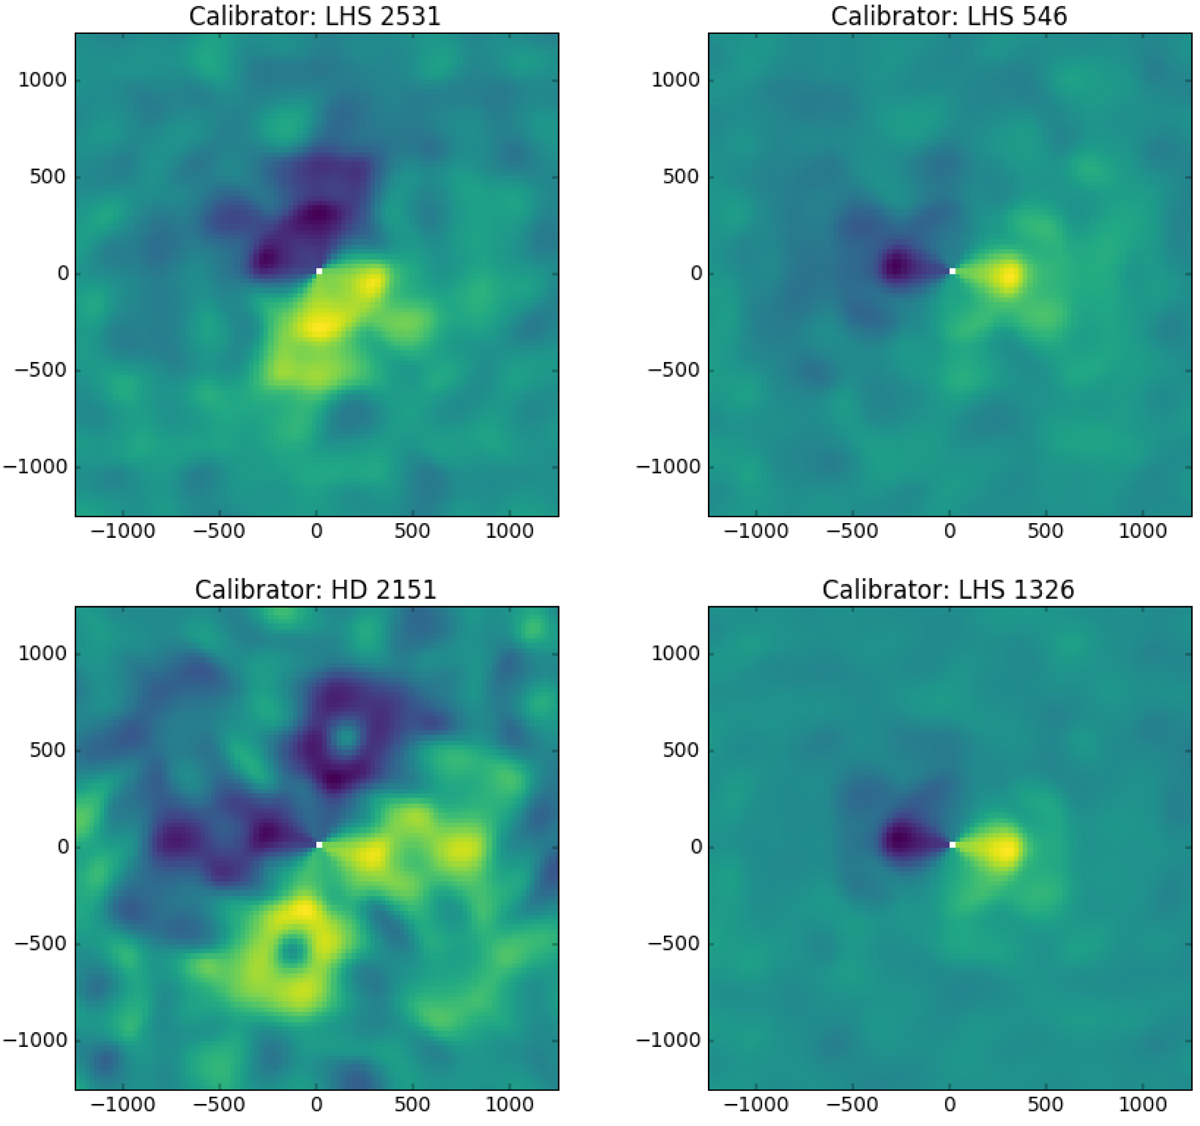
Examples of colinearity maps described in Sect. 3.4 for rejected calibrators (left panels) where the signal from the calibrator is prominent, and selected calibrators (right panels) where the signal of interest is dominant and visible on the right. In the high-contrast approximation, the value of each pixel peaks for the calibrated signal vector colinear to the signal of a companion at the pixel’s location, regardless of its contrast. The map is antisymmetric, reflecting that the kernel-phase is – like the closure phases – a measure of the asymmetries of the target.
Current usage metrics show cumulative count of Article Views (full-text article views including HTML views, PDF and ePub downloads, according to the available data) and Abstracts Views on Vision4Press platform.
Data correspond to usage on the plateform after 2015. The current usage metrics is available 48-96 hours after online publication and is updated daily on week days.
Initial download of the metrics may take a while.