Fig. 5.
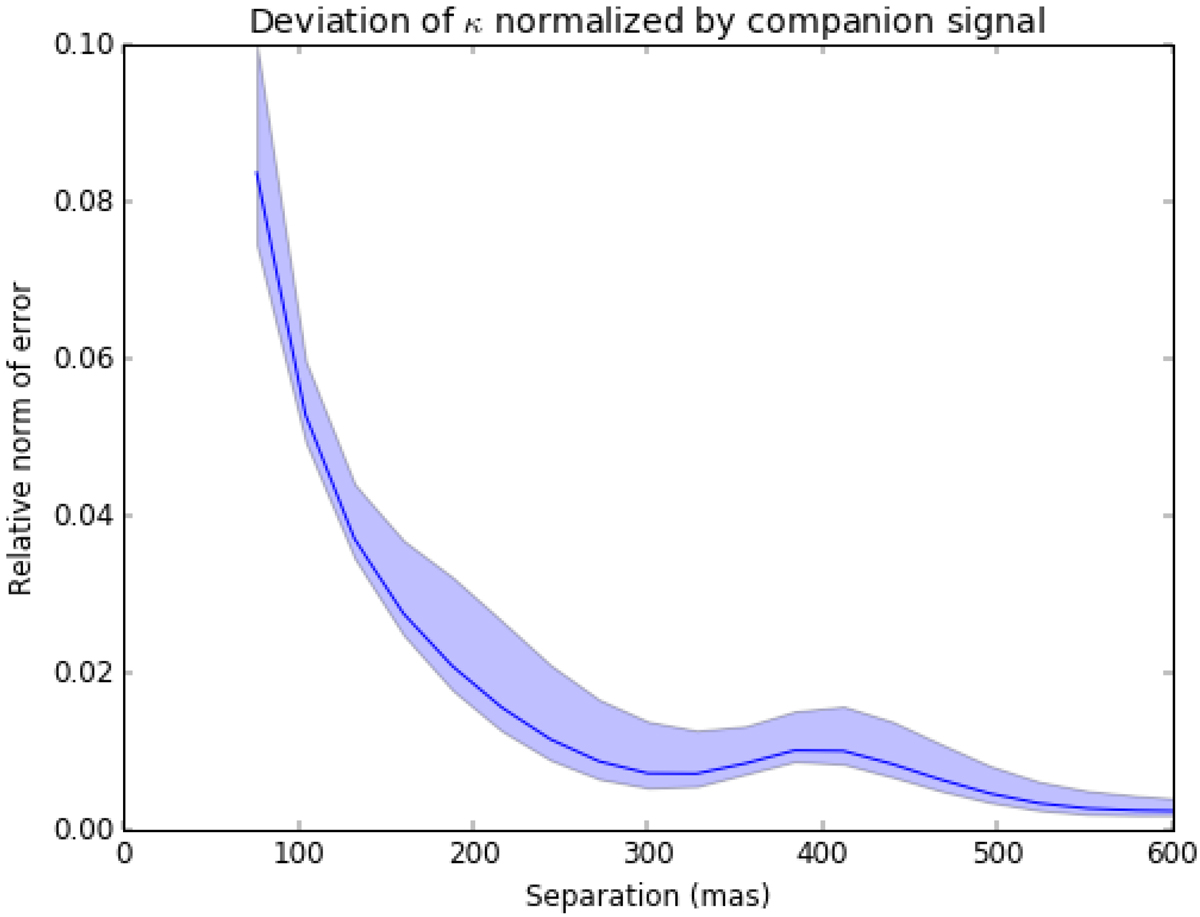
Relative norm of the kernel-phase bias due to saturation-recovery process (normalized by the amplitude of the companion signal) obtained by noiseless simulations. The colored region indicates the range of values for contrasts between 10 and 250, while the solid line indicates their mean. As we can see, the bias quickly drops to below 2% past the ∼1λ/D = 235 mas separation.
Current usage metrics show cumulative count of Article Views (full-text article views including HTML views, PDF and ePub downloads, according to the available data) and Abstracts Views on Vision4Press platform.
Data correspond to usage on the plateform after 2015. The current usage metrics is available 48-96 hours after online publication and is updated daily on week days.
Initial download of the metrics may take a while.