Fig. 9.
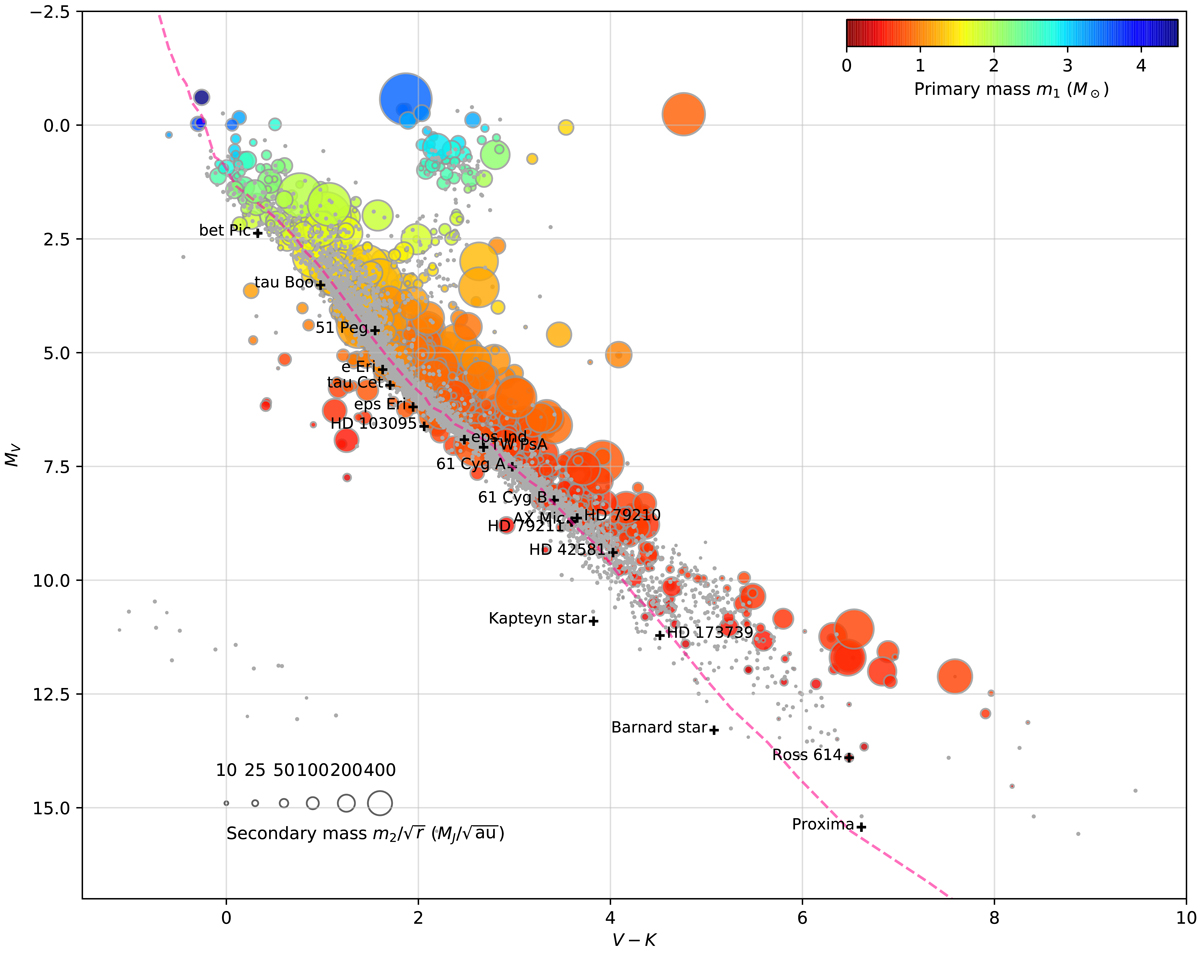
Positions of the stars of our sample within 50 pc in the [MV, V − K] color-magnitude diagram. The stars exhibiting a PMa signal-to-noise ratio ΔG2 > 2 are represented in colors. The symbol size correspond to the normalized companion masse ![]() following the scale displayed in the lower left corner), and the primary mass m1 is represented in color using the scale represented in the upper right corner. The stars with a PMa signal-to-noise ratio ΔG2 ≤ 2 are represented using light gray dots, and the objects discussed individually in Sect. 5 are indicated with “+” symbols. To guide the eye, the main sequence from Pecaut & Mamajek (2013) is represented by a dashed pink curve.
following the scale displayed in the lower left corner), and the primary mass m1 is represented in color using the scale represented in the upper right corner. The stars with a PMa signal-to-noise ratio ΔG2 ≤ 2 are represented using light gray dots, and the objects discussed individually in Sect. 5 are indicated with “+” symbols. To guide the eye, the main sequence from Pecaut & Mamajek (2013) is represented by a dashed pink curve.
Current usage metrics show cumulative count of Article Views (full-text article views including HTML views, PDF and ePub downloads, according to the available data) and Abstracts Views on Vision4Press platform.
Data correspond to usage on the plateform after 2015. The current usage metrics is available 48-96 hours after online publication and is updated daily on week days.
Initial download of the metrics may take a while.