Fig. 8.
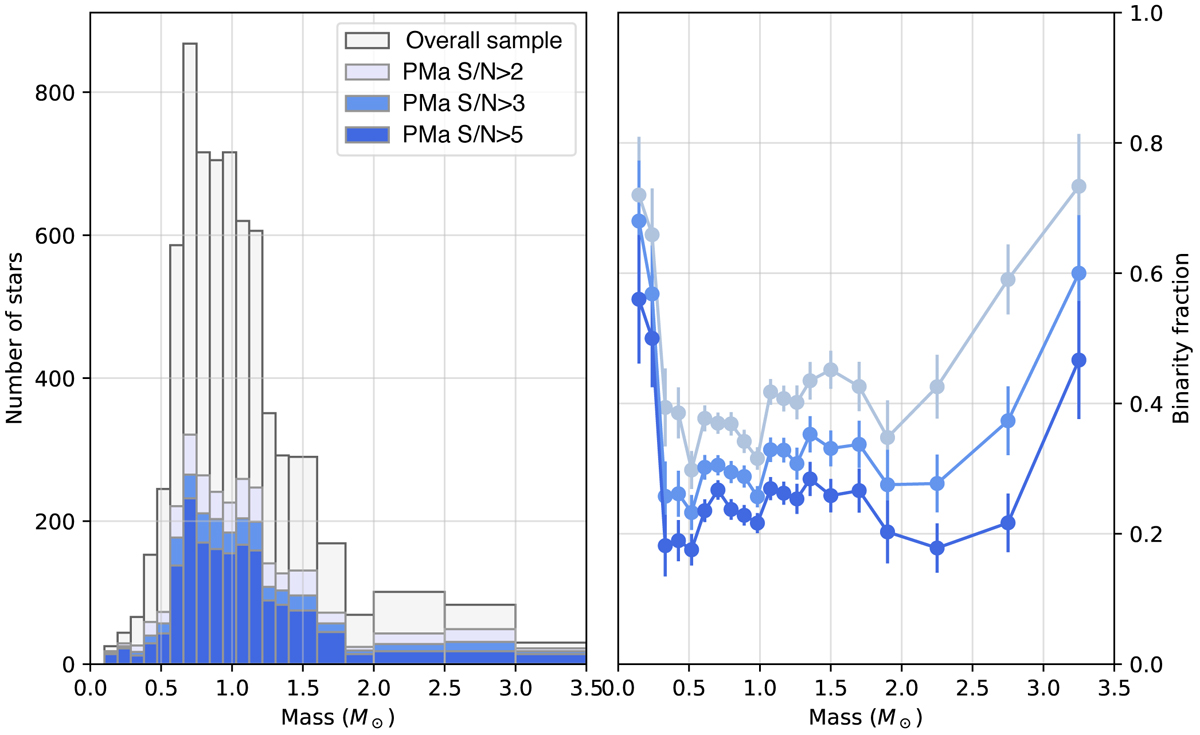
Left: number of stars within 50 pc showing a PMa S/N ΔG2, with thresholds of 2, 3, and 5 (light blue, medium blue and dark blue histograms, respectively) as a function of the primary star mass m1. The histogram of the overall sample is represented in light gray. Right: binarity fraction as a function of the primary star mass m1. The binaries detected considering thresholds of ΔG2 = 2, 3, and 5 are represented with light blue, medium blue, and dark blue lines, respectively.
Current usage metrics show cumulative count of Article Views (full-text article views including HTML views, PDF and ePub downloads, according to the available data) and Abstracts Views on Vision4Press platform.
Data correspond to usage on the plateform after 2015. The current usage metrics is available 48-96 hours after online publication and is updated daily on week days.
Initial download of the metrics may take a while.