Open Access
Fig. 12.
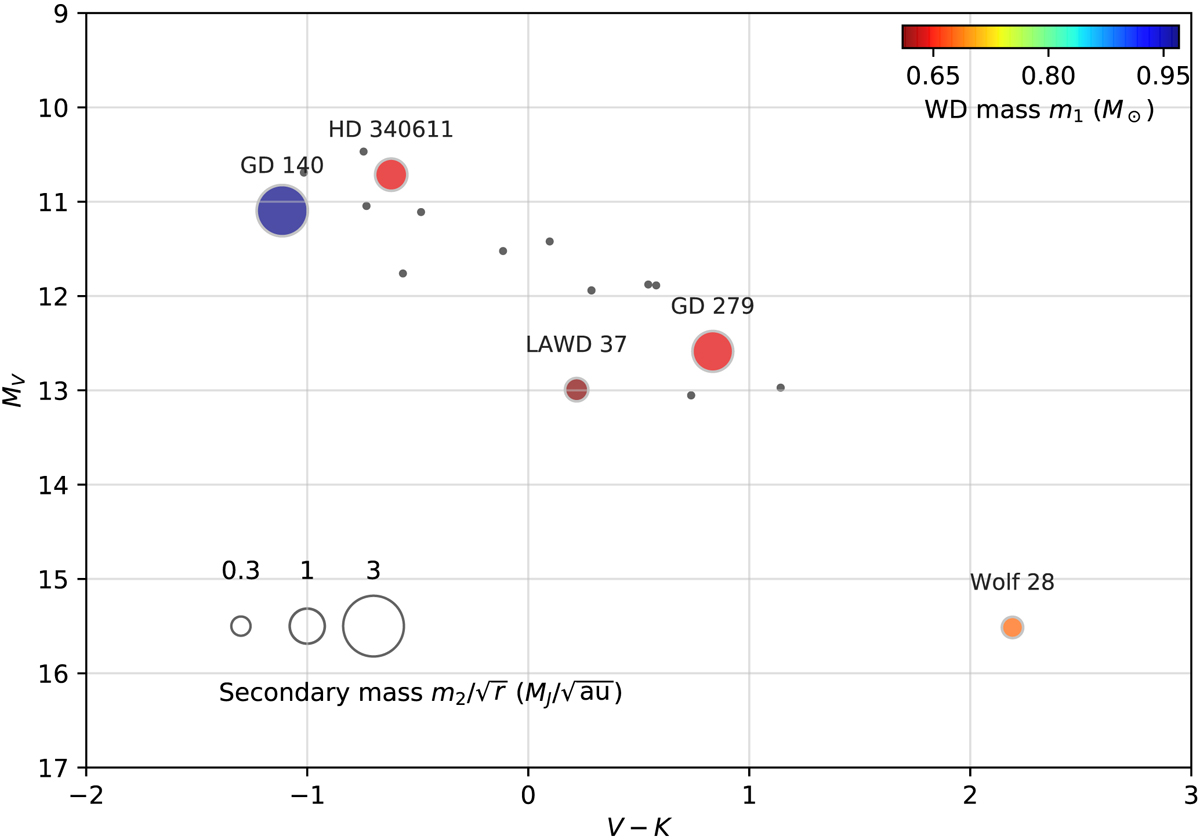
Positions of the white dwarfs of our sample in the [MV, V − K] color-magnitude diagram. The primary mass and the secondary normalized mass are represented with color and symbol size, respectively, only for the stars with a PMa signal-to-noise ratio ΔG2 ≥ 2. The WD with ΔG2 < 2 are represented with a gray dot.
Current usage metrics show cumulative count of Article Views (full-text article views including HTML views, PDF and ePub downloads, according to the available data) and Abstracts Views on Vision4Press platform.
Data correspond to usage on the plateform after 2015. The current usage metrics is available 48-96 hours after online publication and is updated daily on week days.
Initial download of the metrics may take a while.