Open Access
Fig. 10.
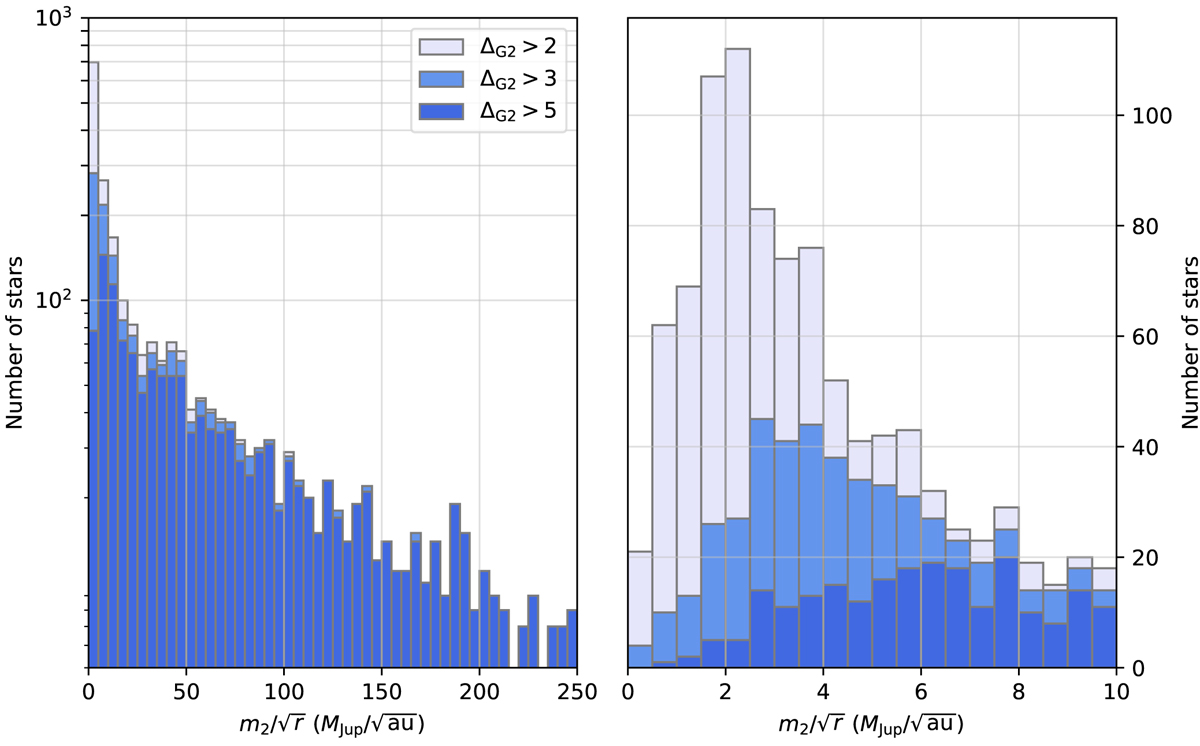
Left panel: histogram of the normalized companion masses ![]() for different levels of PMa signal-to-noise ratio ΔG2. Right panel: enlargement of the histogram of normalized companion masses between 0 and 10 MJ au−1/2.
for different levels of PMa signal-to-noise ratio ΔG2. Right panel: enlargement of the histogram of normalized companion masses between 0 and 10 MJ au−1/2.
Current usage metrics show cumulative count of Article Views (full-text article views including HTML views, PDF and ePub downloads, according to the available data) and Abstracts Views on Vision4Press platform.
Data correspond to usage on the plateform after 2015. The current usage metrics is available 48-96 hours after online publication and is updated daily on week days.
Initial download of the metrics may take a while.