Fig. 1
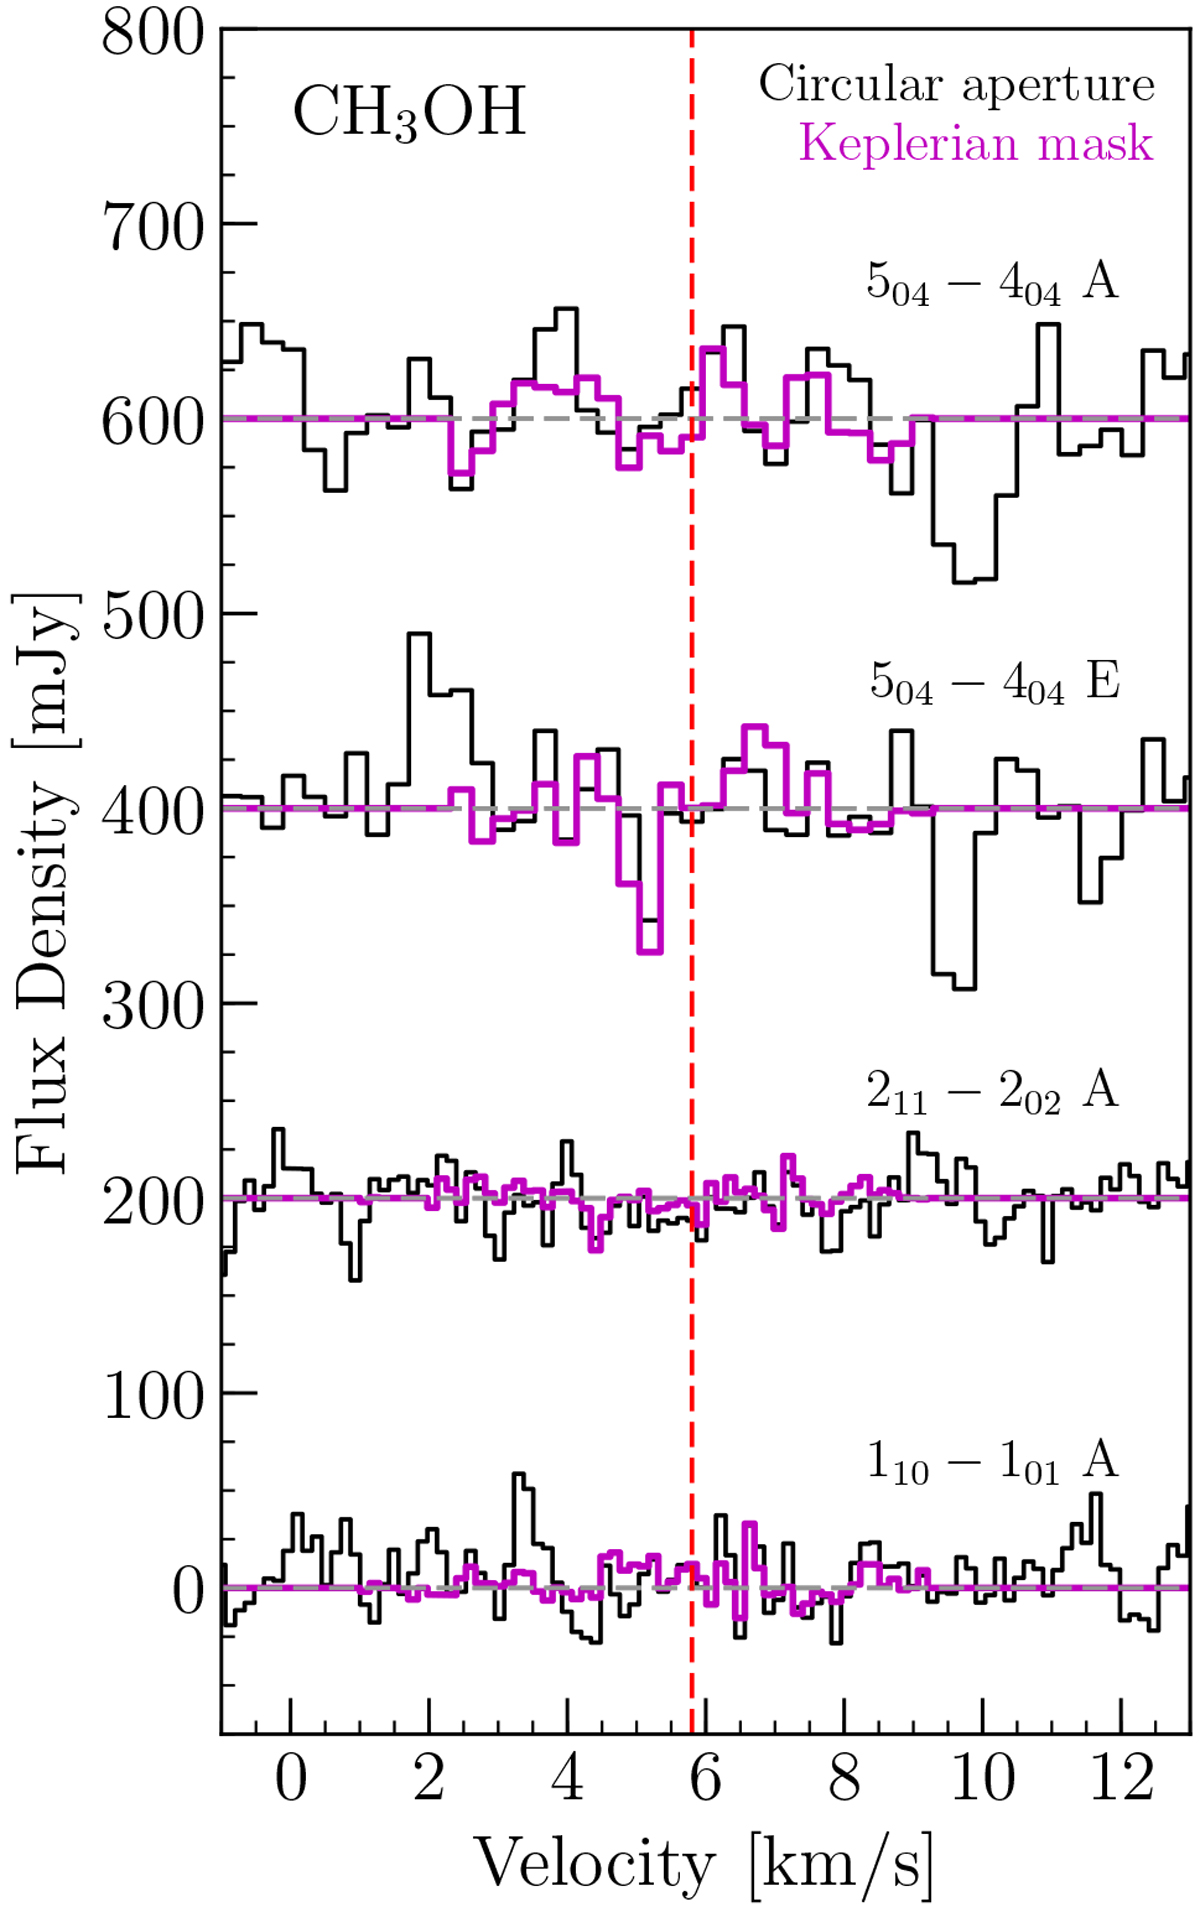
Spectra at the expected velocity of CH3OH line emission in the HD 163296 disk showing non-detections from aperture-masked image cubes using an 8′′ diameter circular aperture (black) and Keplerian-masked image cubes (magenta). The two bottom spectra are observed in band seven in 0.139 km s−1 channels while the two top spectra are in band six in 0.303 km s−1 channels. The horizontal gray dashed line represents the spectrum baseline, which is offset by 200 mJy for each line. The vertical red dashed line shows the systemic velocity at 5.8 km s−1 (Qi et al. 2011).
Current usage metrics show cumulative count of Article Views (full-text article views including HTML views, PDF and ePub downloads, according to the available data) and Abstracts Views on Vision4Press platform.
Data correspond to usage on the plateform after 2015. The current usage metrics is available 48-96 hours after online publication and is updated daily on week days.
Initial download of the metrics may take a while.