Fig. 2
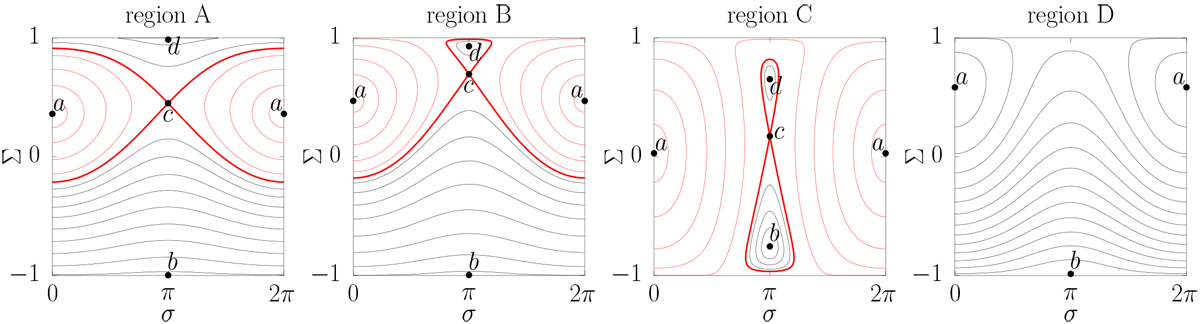
Examples of phase portraits for the four regions of Fig. 1. The equilibrium points are labelled as in Eq. (21). The level curves of the Hamiltonian are drawn with black lines out of the resonance island and with red lines inside the resonance. The parameters chosen are, from A to D: (γ, β) = (0.4, 0.1); (0.55, 0.15); (0.05, 0.7); and (0.8, 0.3).
Current usage metrics show cumulative count of Article Views (full-text article views including HTML views, PDF and ePub downloads, according to the available data) and Abstracts Views on Vision4Press platform.
Data correspond to usage on the plateform after 2015. The current usage metrics is available 48-96 hours after online publication and is updated daily on week days.
Initial download of the metrics may take a while.