Free Access
Fig. 7.
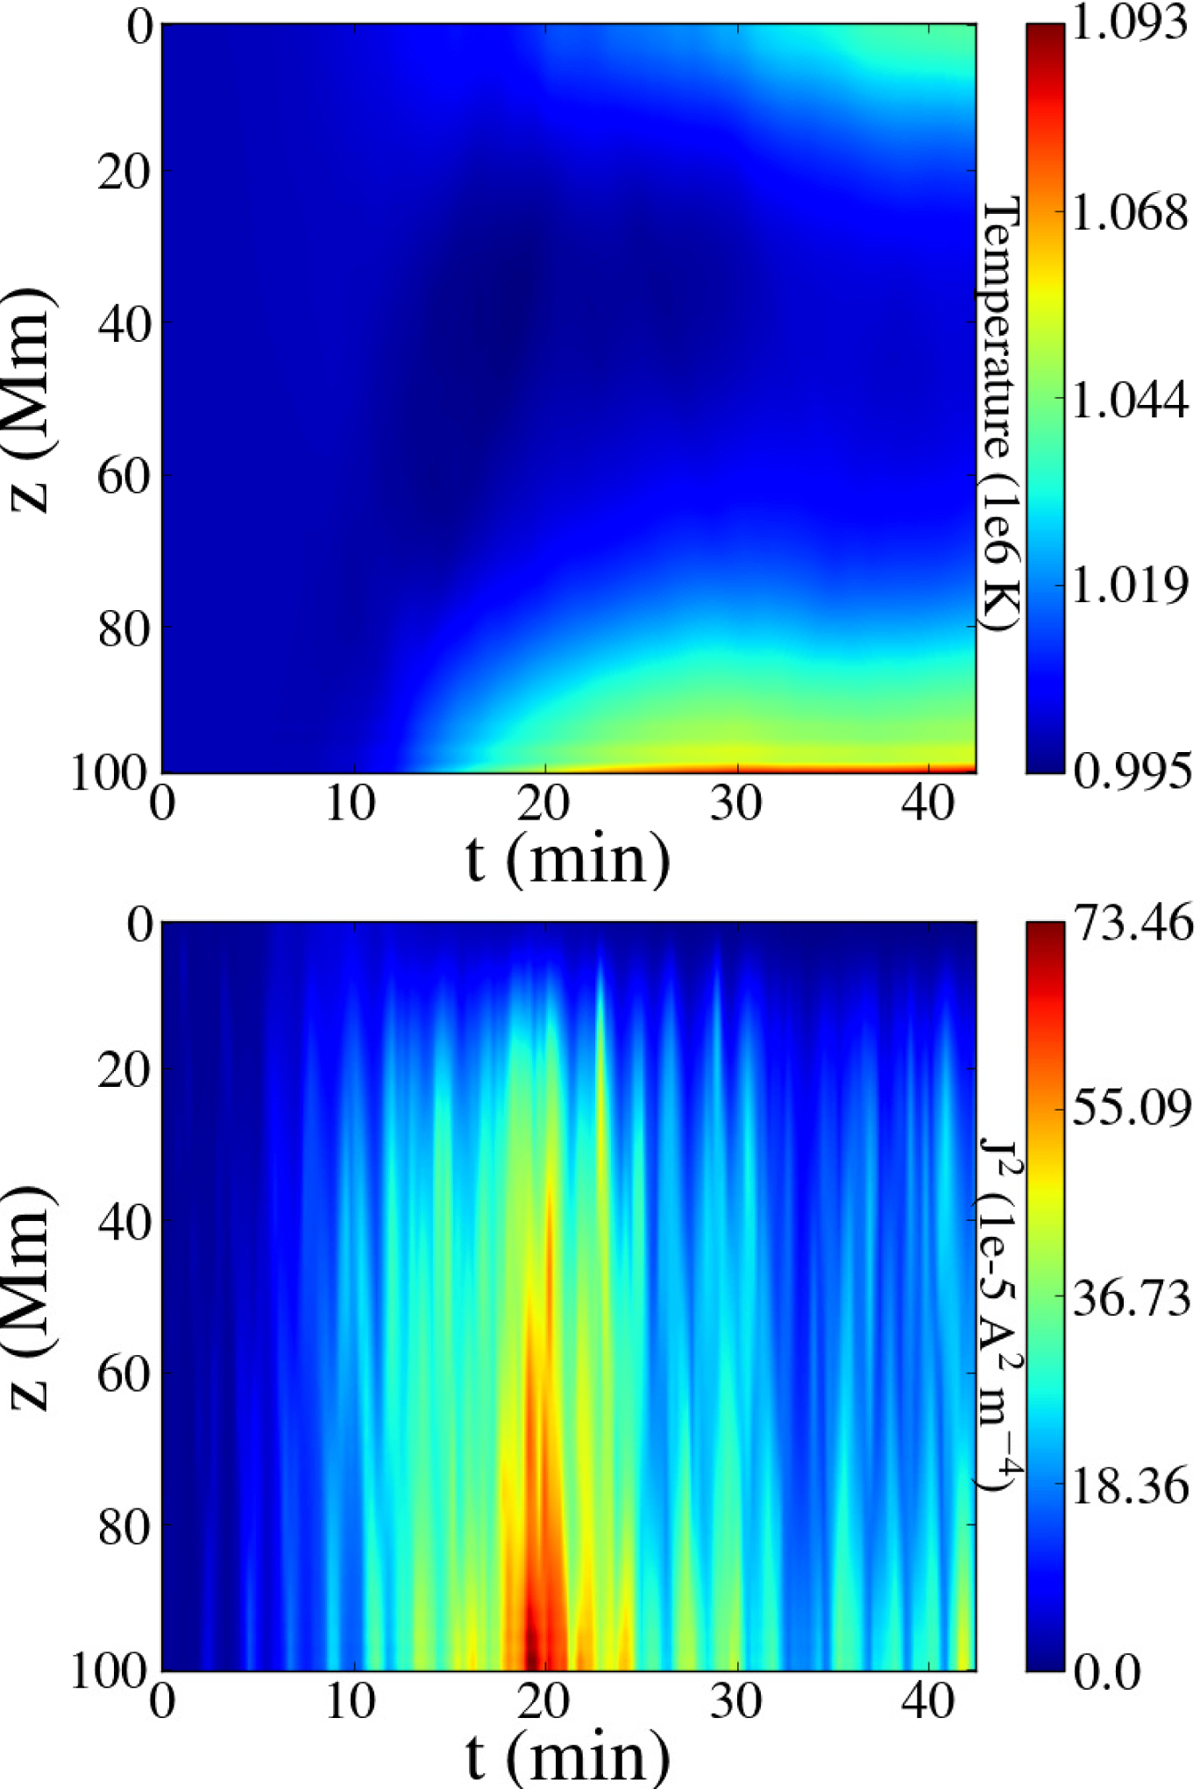
Top panel: average temperature of the flux tube for ρ ≥ 0.9 × 10⁻¹² kg m−3 along the z-axis, for a non-stratified loop with uniform temperature (model 1). Bottom panel: average square current densities (J2) of the flux tube for ρ ≥ 0.9 f(x, y, z) for the same model. The apex is located at z = 0.
Current usage metrics show cumulative count of Article Views (full-text article views including HTML views, PDF and ePub downloads, according to the available data) and Abstracts Views on Vision4Press platform.
Data correspond to usage on the plateform after 2015. The current usage metrics is available 48-96 hours after online publication and is updated daily on week days.
Initial download of the metrics may take a while.