Fig. 3.
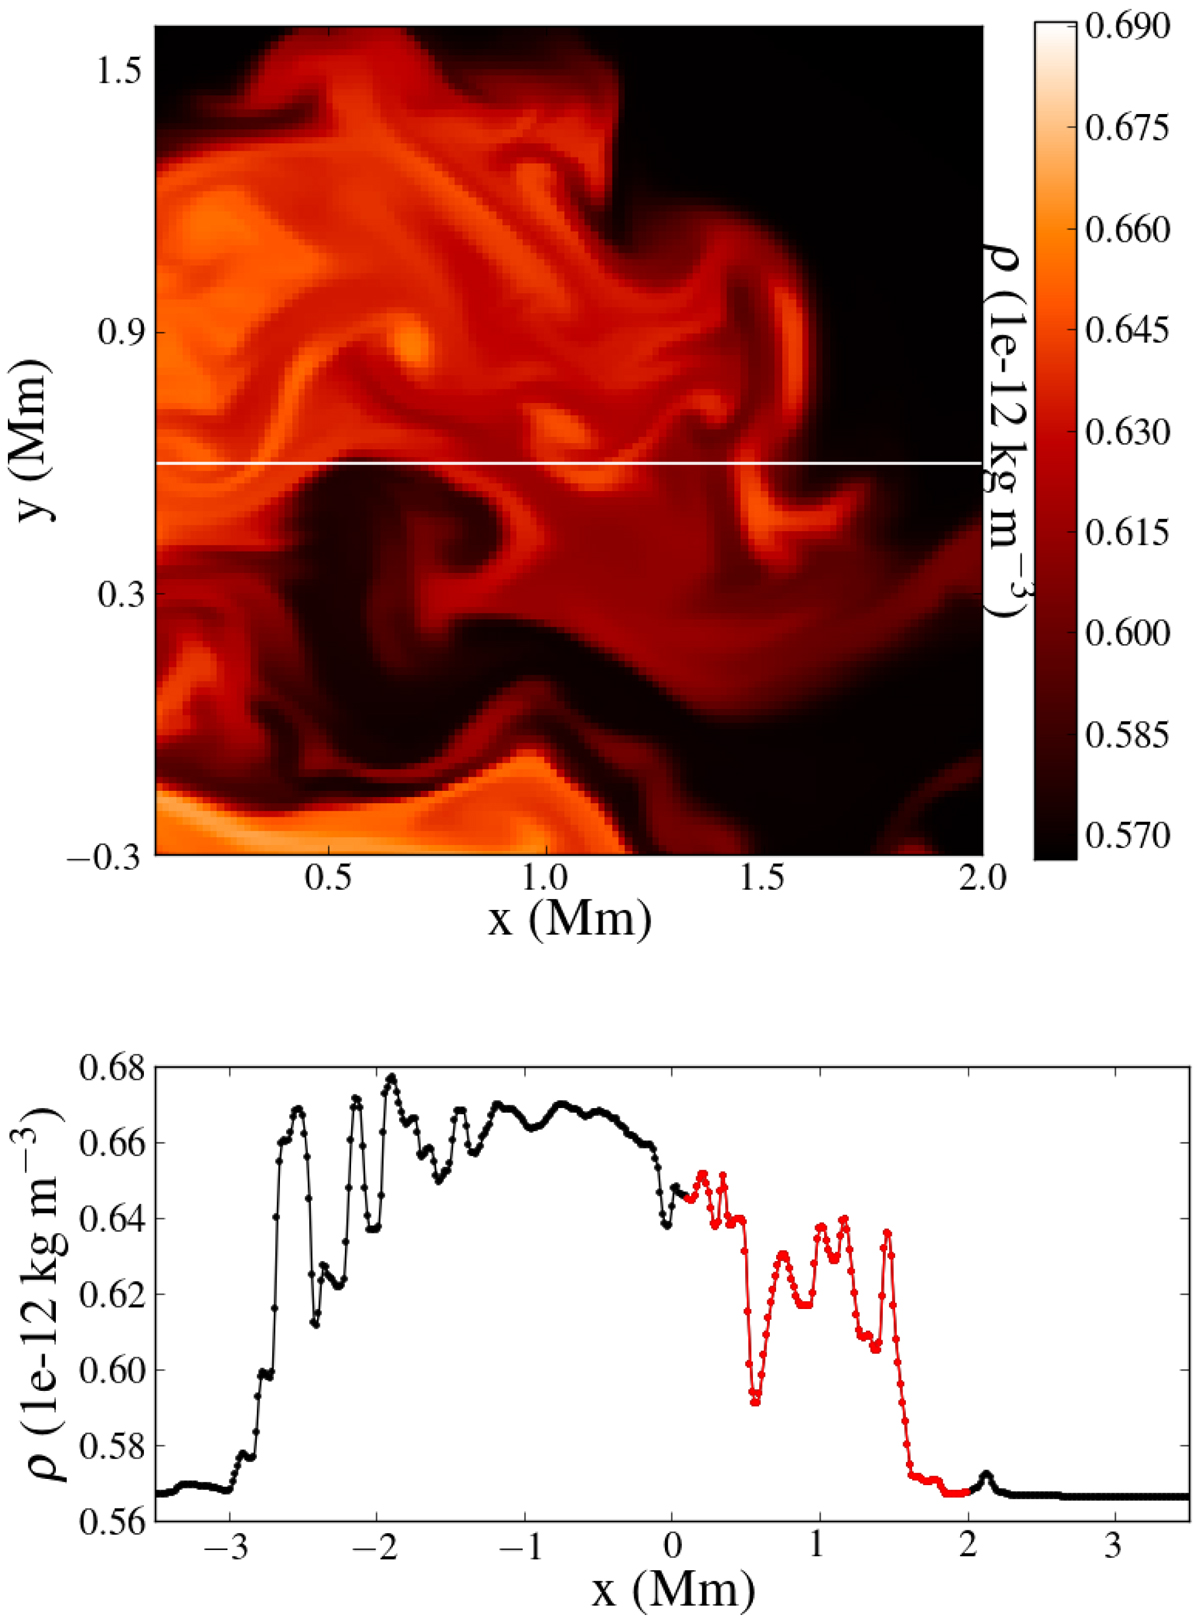
Top image: part of the total density cross section for model ColdI, at the apex. We focus on the area with −0.3 ≤ y (Mm) ≤1.6 and 0.1 ≤ x (Mm) ≤2.0 to highlight the resolution of smaller scale structures on the x − y plane. Bottom image: density structure at y = 0.6 Mm, along the white line of the top image. The dots represent the grid points along the white line. The red line highlights the part visible in the image above. The plot shows time t = 10 P; P = 171 s indicates the period of the driver.
Current usage metrics show cumulative count of Article Views (full-text article views including HTML views, PDF and ePub downloads, according to the available data) and Abstracts Views on Vision4Press platform.
Data correspond to usage on the plateform after 2015. The current usage metrics is available 48-96 hours after online publication and is updated daily on week days.
Initial download of the metrics may take a while.