Fig. B.1
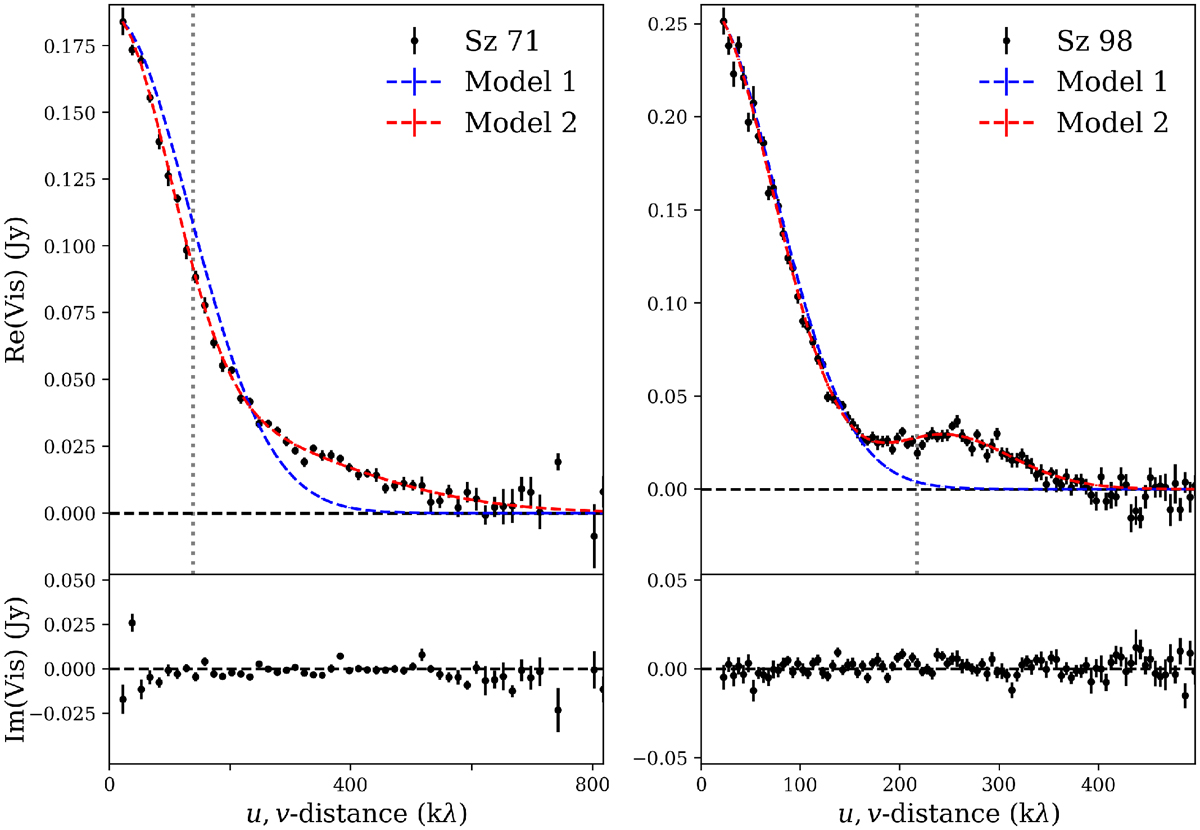
345 GHz continuum visibilities for Sz 71 and Sz 98, after deprojection and derotation. The real visibilities have been overplotted with the best fitted single-component model (Model 1, blue) and the best-fit two-component model (Model 2, red). The best-fit spatial frequency of the two-component model is indicated by the gray dashed lines.
Current usage metrics show cumulative count of Article Views (full-text article views including HTML views, PDF and ePub downloads, according to the available data) and Abstracts Views on Vision4Press platform.
Data correspond to usage on the plateform after 2015. The current usage metrics is available 48-96 hours after online publication and is updated daily on week days.
Initial download of the metrics may take a while.