Fig. 3
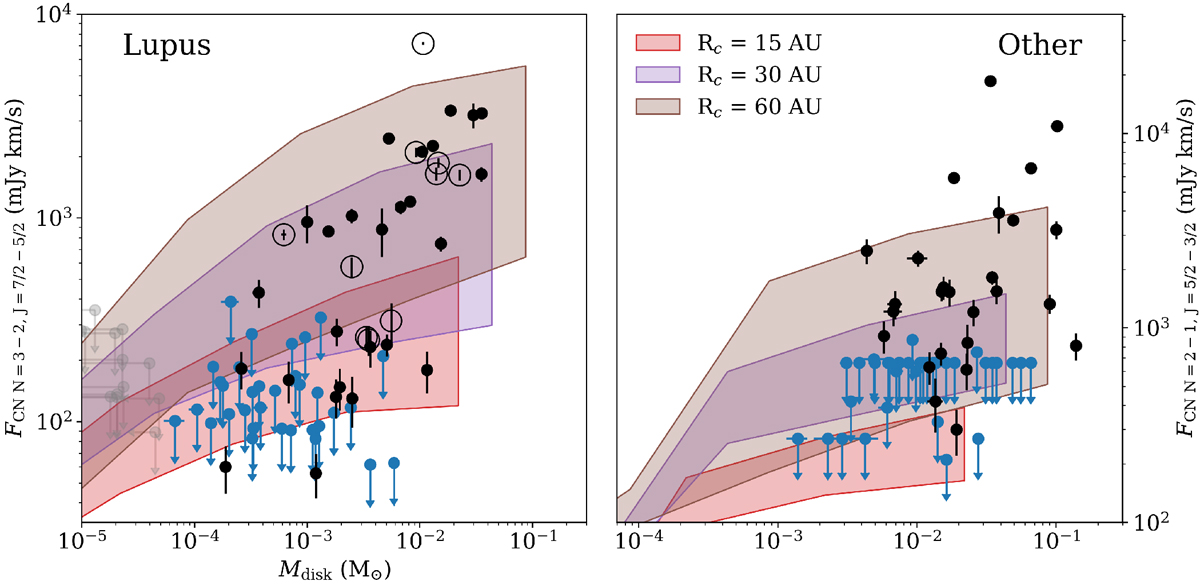
Disk-integrated CN flux vs. disk mass for the Lupus disk sample (left panel) and the previously observed disks in Taurus–Auriga and ρ Oph (Guilloteau et al. 2013; Reboussin et al. 2015; right panel). Detected sources are black, CN flux upper limits are blue, and double upper limits are gray. Colored regions indicate model results for the areas of parameter space covered by different UV fluxes and disk masses for a given Rc. Transition disks are marked with a circle and were not modeled. Fluxes for the Taurus–Auriga and ρ Oph sourcesand models are scaled to a 140 pc distance.
Current usage metrics show cumulative count of Article Views (full-text article views including HTML views, PDF and ePub downloads, according to the available data) and Abstracts Views on Vision4Press platform.
Data correspond to usage on the plateform after 2015. The current usage metrics is available 48-96 hours after online publication and is updated daily on week days.
Initial download of the metrics may take a while.