Fig. D.3
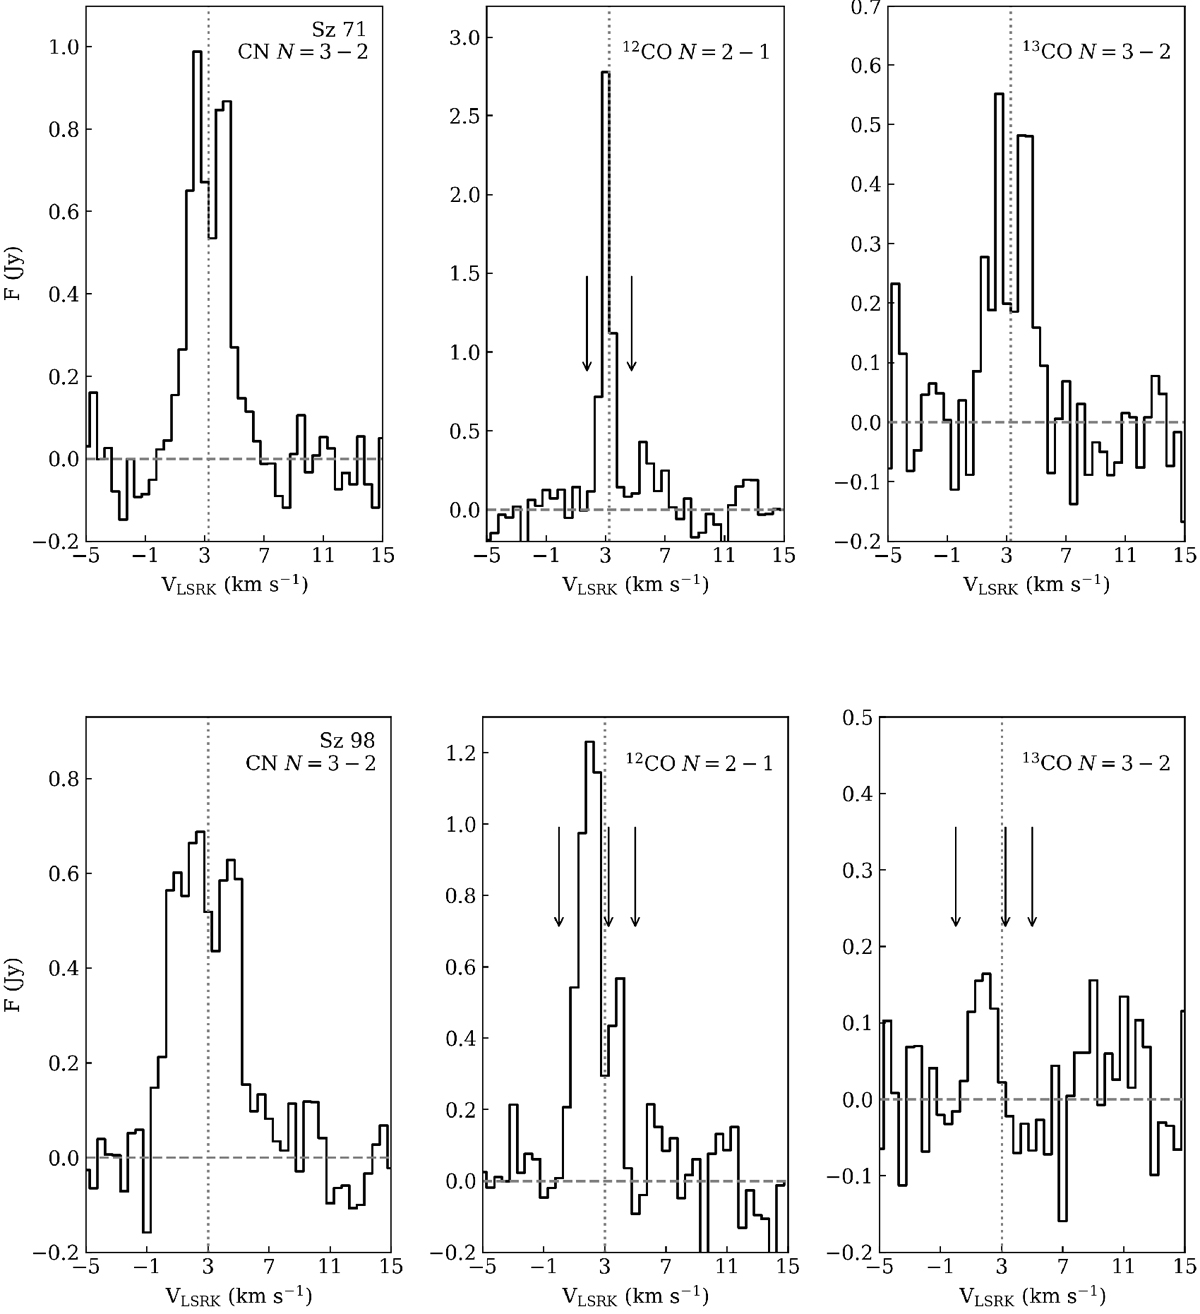
Spectra of CN (focusing on the brightest N = 3−2, J = 7∕2−5∕2 components) and the main CO isotopologs for Sz 71 (top panels) and Sz 98 (bottom panels). Arrows show the velocities of foreground cloud material (partially) absorbing the 12CO line. Vertical dotted lines indicate the source velocity. The scale of the y-axis varies between panels. All spectra were extracted in an aperture overlapping with the detection in the moment-zero map (for 12CO), or in a 2″ aperture on the source location (for CN and 13CO).
Current usage metrics show cumulative count of Article Views (full-text article views including HTML views, PDF and ePub downloads, according to the available data) and Abstracts Views on Vision4Press platform.
Data correspond to usage on the plateform after 2015. The current usage metrics is available 48-96 hours after online publication and is updated daily on week days.
Initial download of the metrics may take a while.