Fig. 8
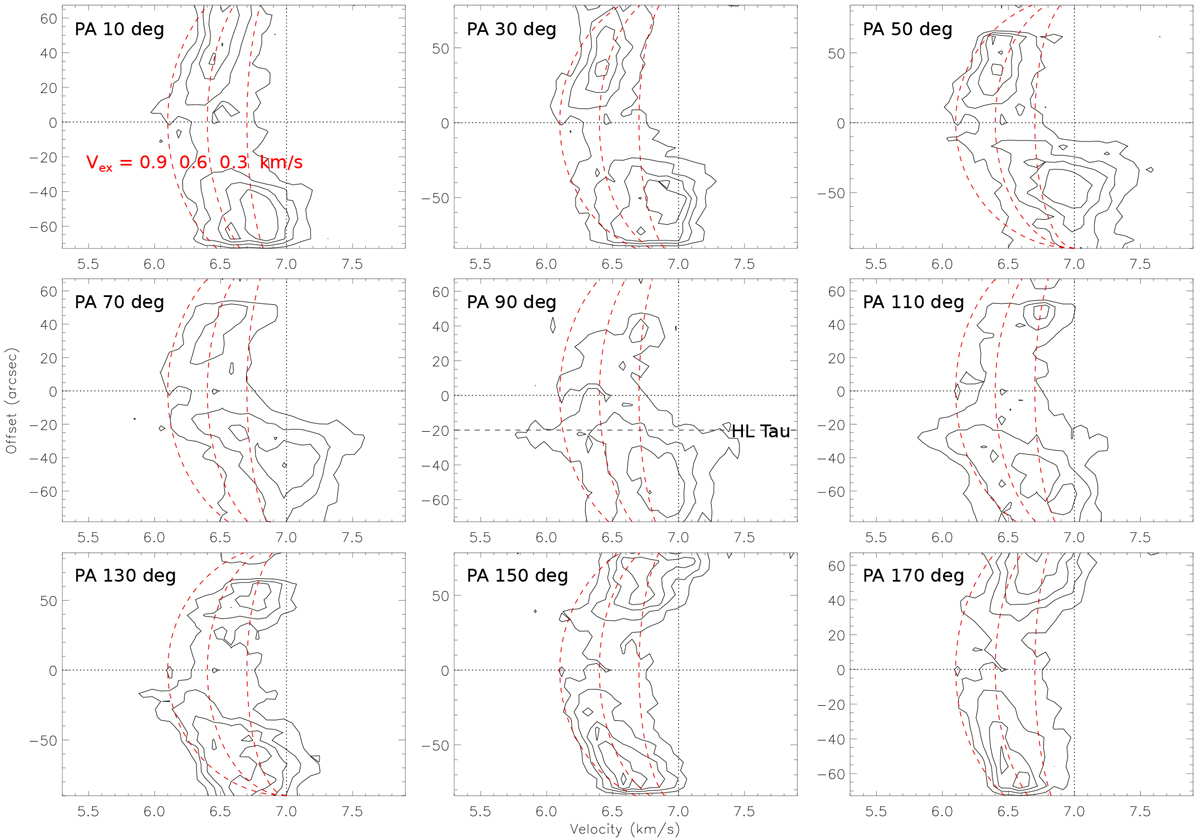
Position–velocity (PV) diagrams of the C18O (2–1) emission obtained with the IRAM 30m observations. The PV diagrams were extracted along different position angles (labeled at the upper left corner in each panel) and passing through the position of XZ Tau, which is shown as zero offset and denoted with horizontal dotted lines. Vertical dotted lines present the systemic velocity of HL Tau measured from the Keplerian rotation of the HL Tau disk. The position of HL Tau is at the offset of −20′′, denoted as a horizontal dashed line, in the PV diagram along PA of 90°. Red dashed curves from right to left in each panel present the expected velocity profiles of the expanding shell with expanding velocities of 0.3, 0.6, and 0.9 km s−1, respectively, as labeled in the PV diagram along PA of 10°.
Current usage metrics show cumulative count of Article Views (full-text article views including HTML views, PDF and ePub downloads, according to the available data) and Abstracts Views on Vision4Press platform.
Data correspond to usage on the plateform after 2015. The current usage metrics is available 48-96 hours after online publication and is updated daily on week days.
Initial download of the metrics may take a while.