Fig. 7
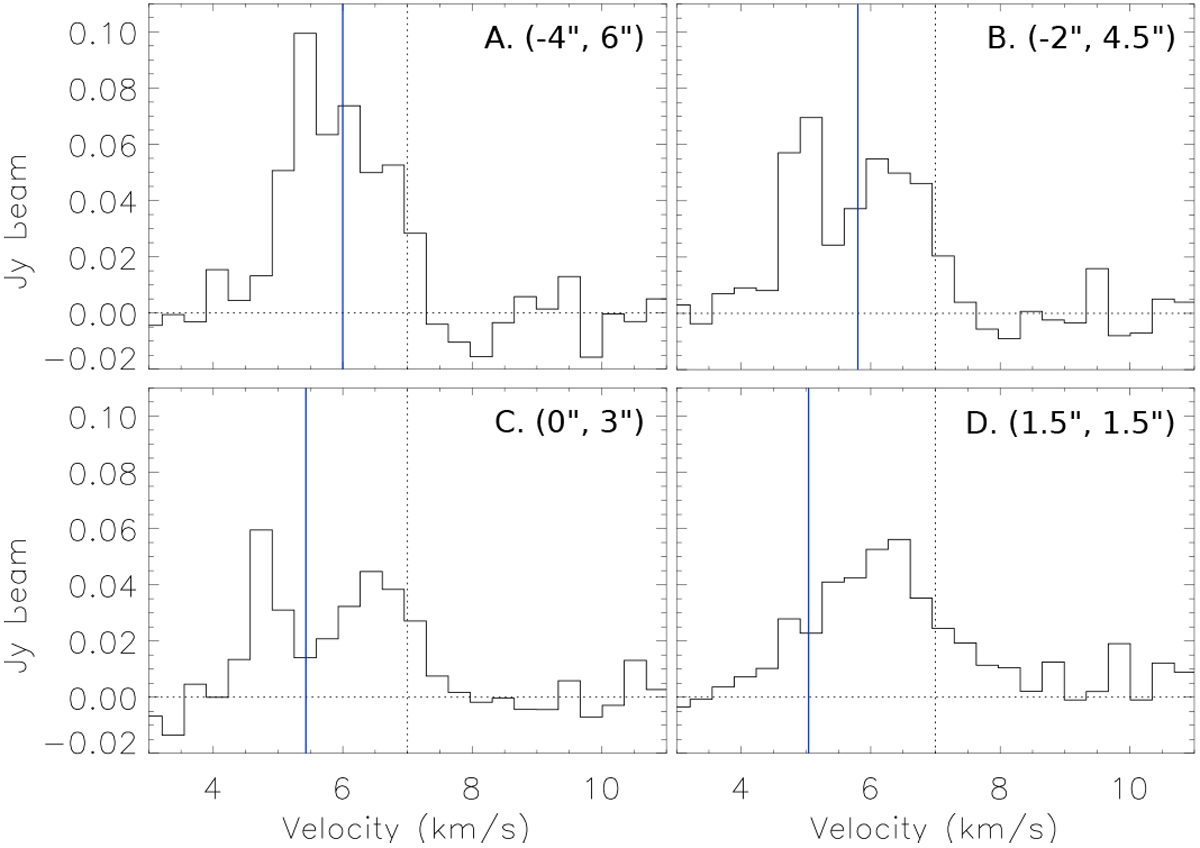
Spectra of the C18O (2–1) emission extracted from the combined data. The relative offsets of the positions A–D, where the spectra were extracted, with respect to the position of HL Tau are shown at the upper right corners in the panels. These positions are also labeled in Fig. 5. Dotted vertical lines denote the systemic velocity of HL Tau, VLSR = 7 km s−1, measured from the Keplerian rotation of its disk (Yen et al. 2017). Blue vertical lines show the expected line-of-sight velocities from the model of a free-falling and rotating envelope at those positions (Yen et al. 2017).
Current usage metrics show cumulative count of Article Views (full-text article views including HTML views, PDF and ePub downloads, according to the available data) and Abstracts Views on Vision4Press platform.
Data correspond to usage on the plateform after 2015. The current usage metrics is available 48-96 hours after online publication and is updated daily on week days.
Initial download of the metrics may take a while.