Fig. 5
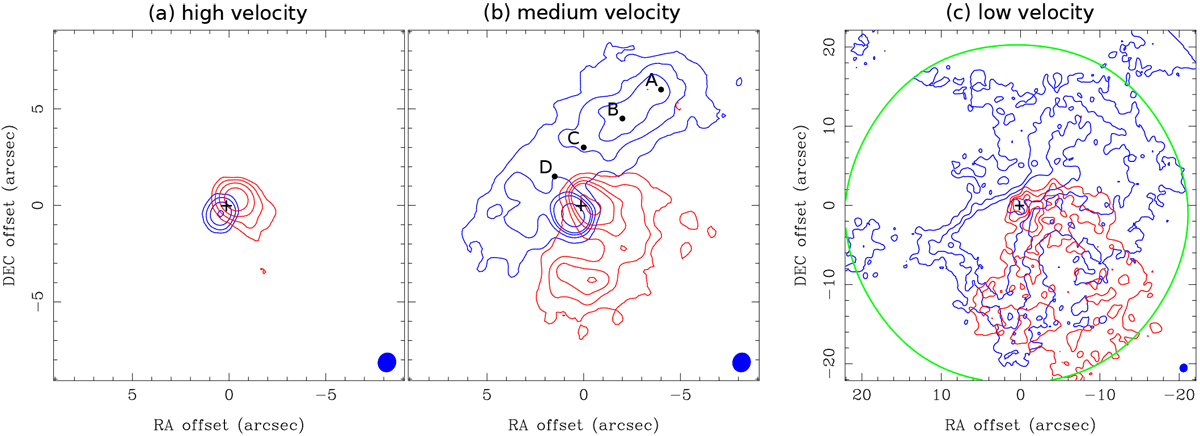
Same as Fig. 4 but for the C18O (2–1) emission. The integrated velocity ranges are high velocities of VLSR = 1–4 and 8.6–13.4 km s−1, medium velocities of VLSR = 4–5.6 and 7.8–8.6 km s−1, and low velocities of VLSR = 5.6–7 and 7–7.8 km s−1. Contour levels are from 5σ and increase in steps of a factor two in panels a and b, and those are 10σ, 15σ, 20σ, 40σ, and 80σ in panel c. 1σ levels of the integrated blue- and redshifted emission are 4.2 and 5.9 mJy beam−1 km s−1 in panel a, both 3.2 mJy beam−1 km s−1 in panel b, and 3.7 and 2.6 mJy beam−1 km s−1 in panel c. The positions to extract spectra, which are shown in Fig. 7, are labeled as A–D in panel b.
Current usage metrics show cumulative count of Article Views (full-text article views including HTML views, PDF and ePub downloads, according to the available data) and Abstracts Views on Vision4Press platform.
Data correspond to usage on the plateform after 2015. The current usage metrics is available 48-96 hours after online publication and is updated daily on week days.
Initial download of the metrics may take a while.