Fig. 4
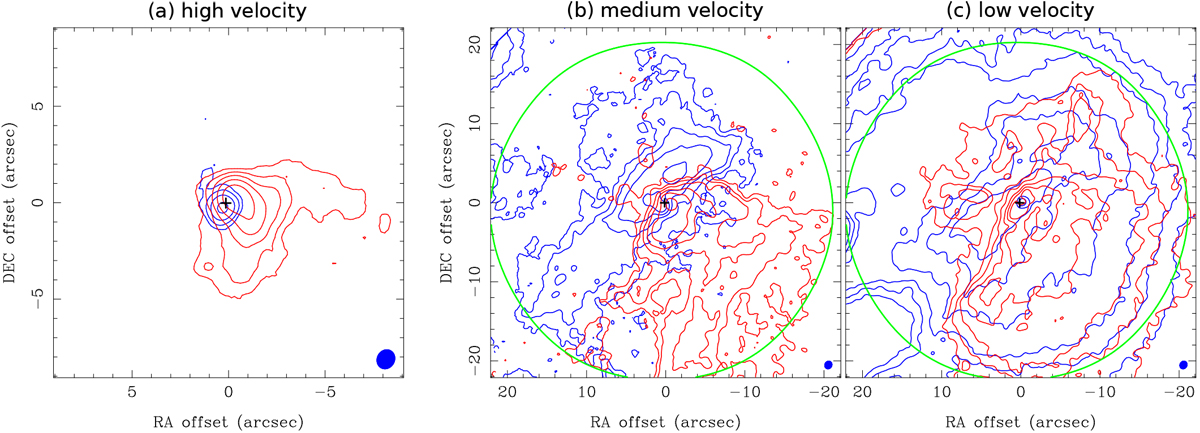
Moment 0 maps of the 13CO (2–1) emission integrated over the different velocity ranges from the combined data obtained with the IRAM 30m, ACA, and ALMA observations. The integrated velocity ranges are high velocities of VLSR = 3–4.7 and 8.5–12 km s−1, medium velocities of VLSR = 4.7–5.4 and 7.8–8.5 km s−1, and low velocities of VLSR = 5.4–7.1 and 7.1–7.8 km s−1. Blue and red contours show the blue- and redshifted emission, respectively. Contour levels are from 5σ and increase in steps of a factor of two in panels a and b, and those are 20σ, 30σ, 40σ, and then in steps of 20σ in panel c. 1σ levels of the integrated blue- and redshifted emission are 6 and 7.4 mJy beam−1 km s−1 in panel a, 4.6 and 3.4 mJy beam−1 km s−1 in panel b, and 3.8 and 3.1 mJy beam−1 km s−1 in panel c. Crosses denote the position of HL Tau. Filled blue ellipses present the size of the synthesized beam. Green circles show the region where the primary beam response is 0.5.
Current usage metrics show cumulative count of Article Views (full-text article views including HTML views, PDF and ePub downloads, according to the available data) and Abstracts Views on Vision4Press platform.
Data correspond to usage on the plateform after 2015. The current usage metrics is available 48-96 hours after online publication and is updated daily on week days.
Initial download of the metrics may take a while.