Fig. 3
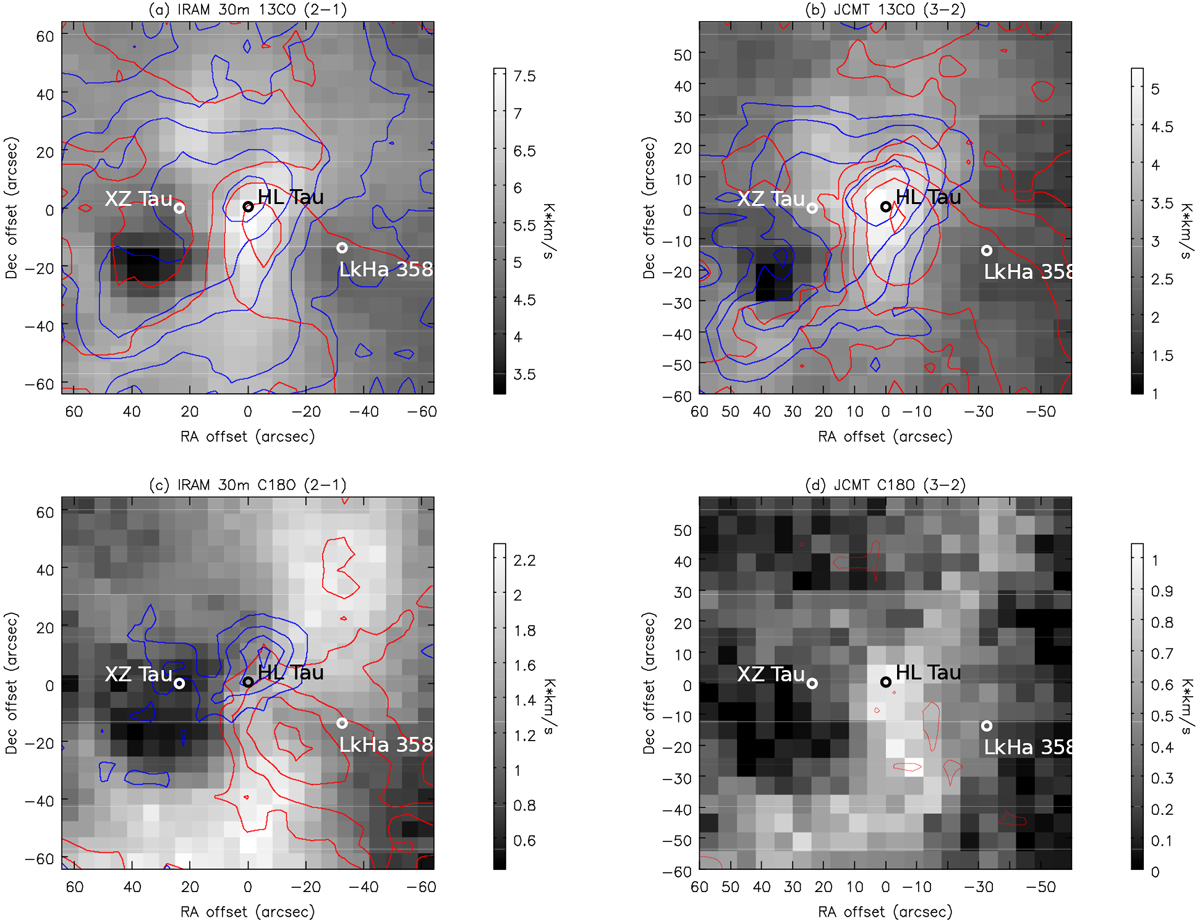
Single-dish moment 0 maps of the 13CO (2–1) and (3–2) emission (panels a and b) and the C18O (2–1) and (3–2) emission (panels c and d) integrated over different velocity ranges. Grayscales present the integrated intensity in the velocity range close to the velocity of the intensity peak VLSR = 6.2–7.1 km s−1. Blue and red contours present the integrated intensity at the higher relative velocities with respect to the peak velocity, VLSR < 6.2 km s−1 and VLSR > 7.1 km s−1, respectively. Contours are from 3σ and increase in steps of a factor of two. 1σ levels of the integrated blue- and redshifted emission are 0.09 and 0.11 K km s−1 in panel a, 0.11 and 0.1 K km s−1 in panel b, and 0.04 and 0.07 K km s−1 in panel c. Inthe C18O (3–2) line, there is no clear emission detected at the blueshifted high velocity, and the 1σ level of the integrated redshifted emission is 0.1 K km s−1.
Current usage metrics show cumulative count of Article Views (full-text article views including HTML views, PDF and ePub downloads, according to the available data) and Abstracts Views on Vision4Press platform.
Data correspond to usage on the plateform after 2015. The current usage metrics is available 48-96 hours after online publication and is updated daily on week days.
Initial download of the metrics may take a while.