Fig. 2
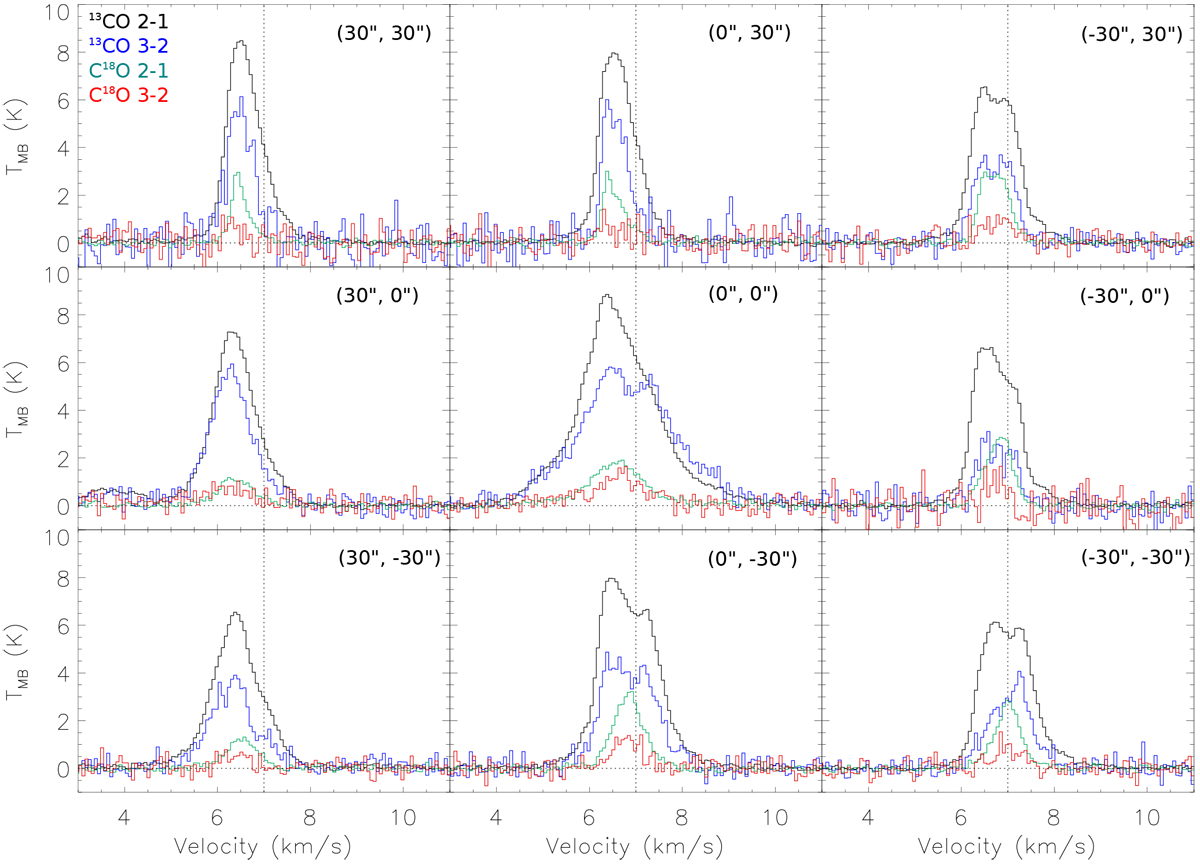
Spectra of the 13CO (2–1; black histograms) and (3–2; blue histograms) emission and the C18O (2–1; green histograms) and (3–2; red histograms) emission at nine different positions in the HL Tau region obtained with our single-dish observations. The position at which the spectra were extracted is labeled at the upper right corner in each panel in relative offset with respect to the position of HL Tau. Vertical dashed lines denote the systemic velocity of HL Tau, VLSR = 7 km s−1.
Current usage metrics show cumulative count of Article Views (full-text article views including HTML views, PDF and ePub downloads, according to the available data) and Abstracts Views on Vision4Press platform.
Data correspond to usage on the plateform after 2015. The current usage metrics is available 48-96 hours after online publication and is updated daily on week days.
Initial download of the metrics may take a while.