Fig. A.1
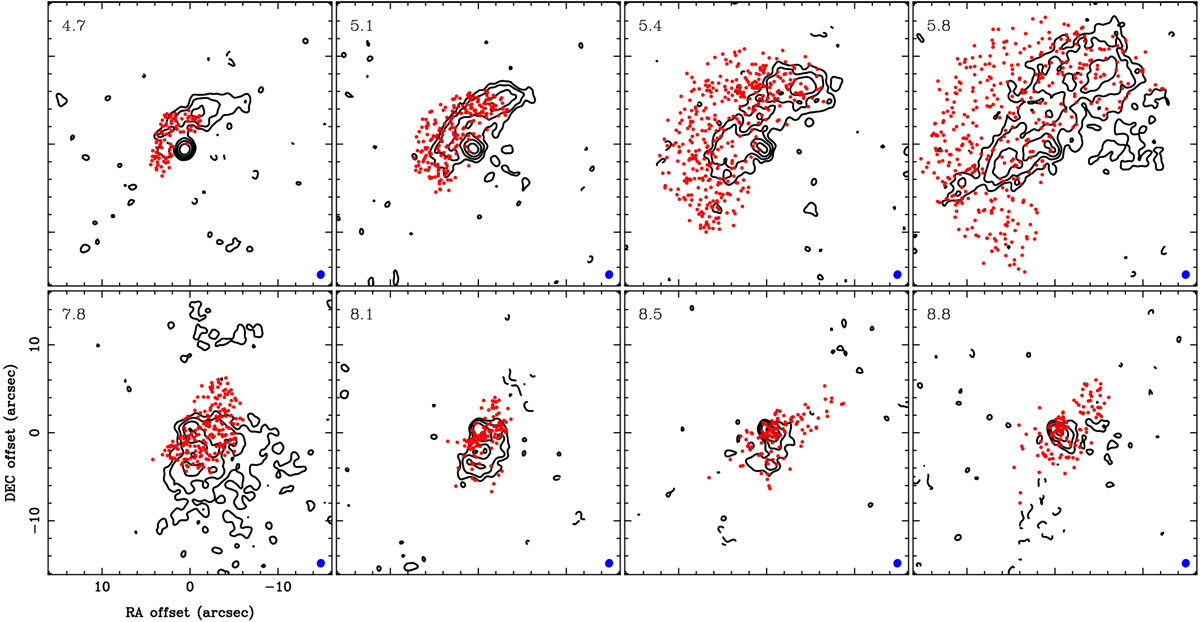
Observed velocity channel maps of the C18O emission (contour) overlaid with the particle distributions (red dots) at the same line-of-sight velocities from our kinematical model with Vrel of 0.6 km s−1 after an evolutionary time of 104 yr. Contour levels are from 3σ and increase in steps of a factor of two, where 1σ is 5.5 mJy Beam−1. The central velocity of each channel is labeled at the upper left corner in each panel in units of km s−1. Blue filled ellipses show the size of the synthesized beam.
Current usage metrics show cumulative count of Article Views (full-text article views including HTML views, PDF and ePub downloads, according to the available data) and Abstracts Views on Vision4Press platform.
Data correspond to usage on the plateform after 2015. The current usage metrics is available 48-96 hours after online publication and is updated daily on week days.
Initial download of the metrics may take a while.