Fig. 9.
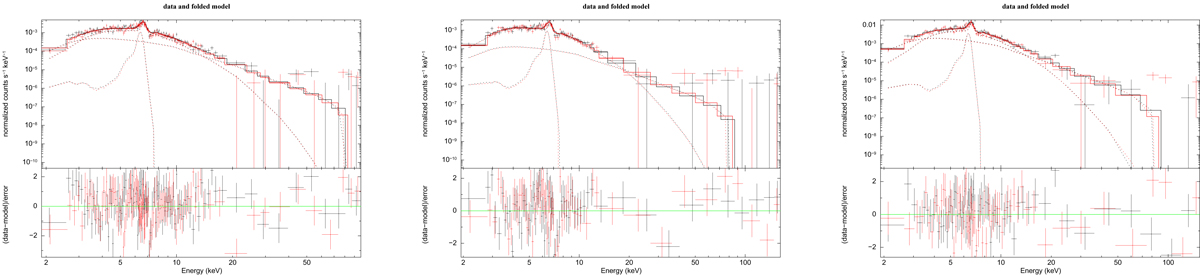
NuSTAR FPM A and B spectra in three different time intervals. Black indicates FPMA, red indicates FPMB. The best-fit models (dashed lines) and the χ2 terms in units of σ (bottom panels) are also shown. Left panel: average NuSTAR spectra accumulated on the total exposure (≈260 ks). Central panel: spectra during the quiescent phase. Right panel: Spectra during the two flares.
Current usage metrics show cumulative count of Article Views (full-text article views including HTML views, PDF and ePub downloads, according to the available data) and Abstracts Views on Vision4Press platform.
Data correspond to usage on the plateform after 2015. The current usage metrics is available 48-96 hours after online publication and is updated daily on week days.
Initial download of the metrics may take a while.