Fig. 8.
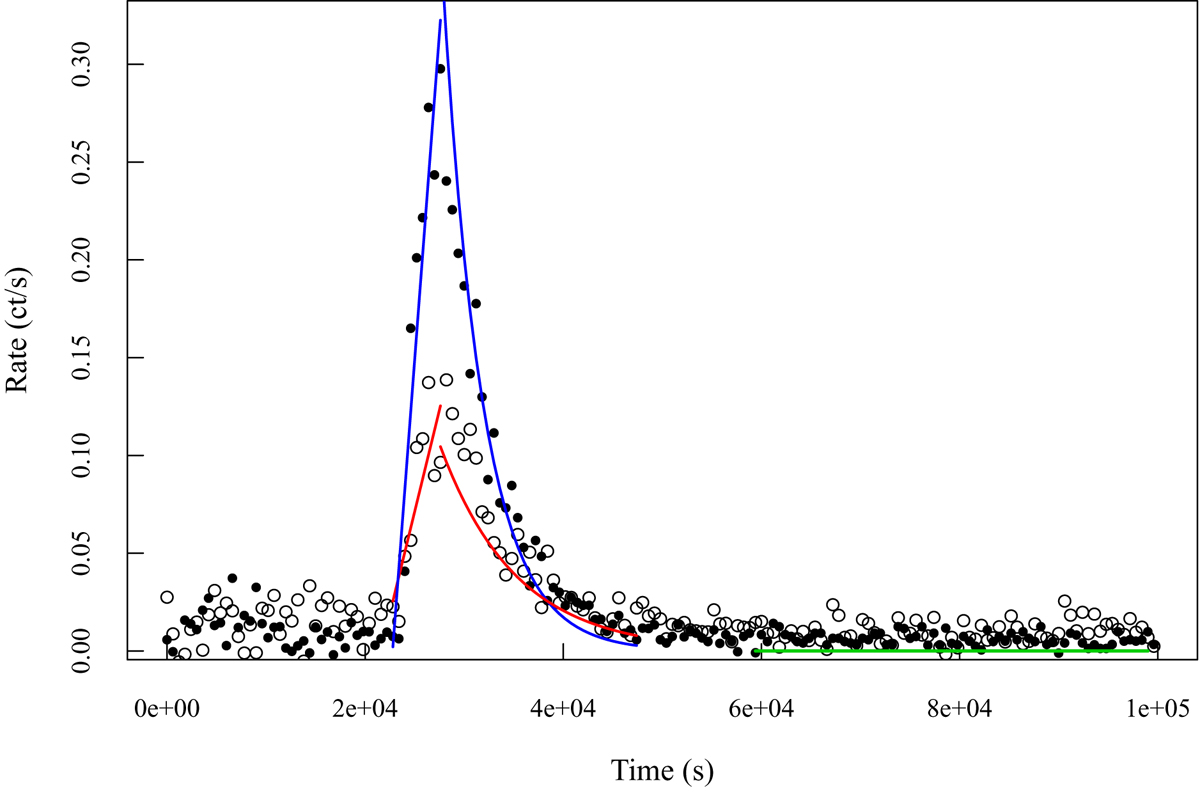
XMM-Newton PN light curves in the 0.3 − 5.0 keV (open circles) and 5 − 8 keV (solid dots) with the best fit of the rise phase (linear increase) and decay phase (exponential decrease). The rates are subtracted from the respective background rates. The green segment indicates the interval where the median of the quiescent rate has been calculated. The quiescent rate has been subtracted to derive the decay times.
Current usage metrics show cumulative count of Article Views (full-text article views including HTML views, PDF and ePub downloads, according to the available data) and Abstracts Views on Vision4Press platform.
Data correspond to usage on the plateform after 2015. The current usage metrics is available 48-96 hours after online publication and is updated daily on week days.
Initial download of the metrics may take a while.