Fig. 7.
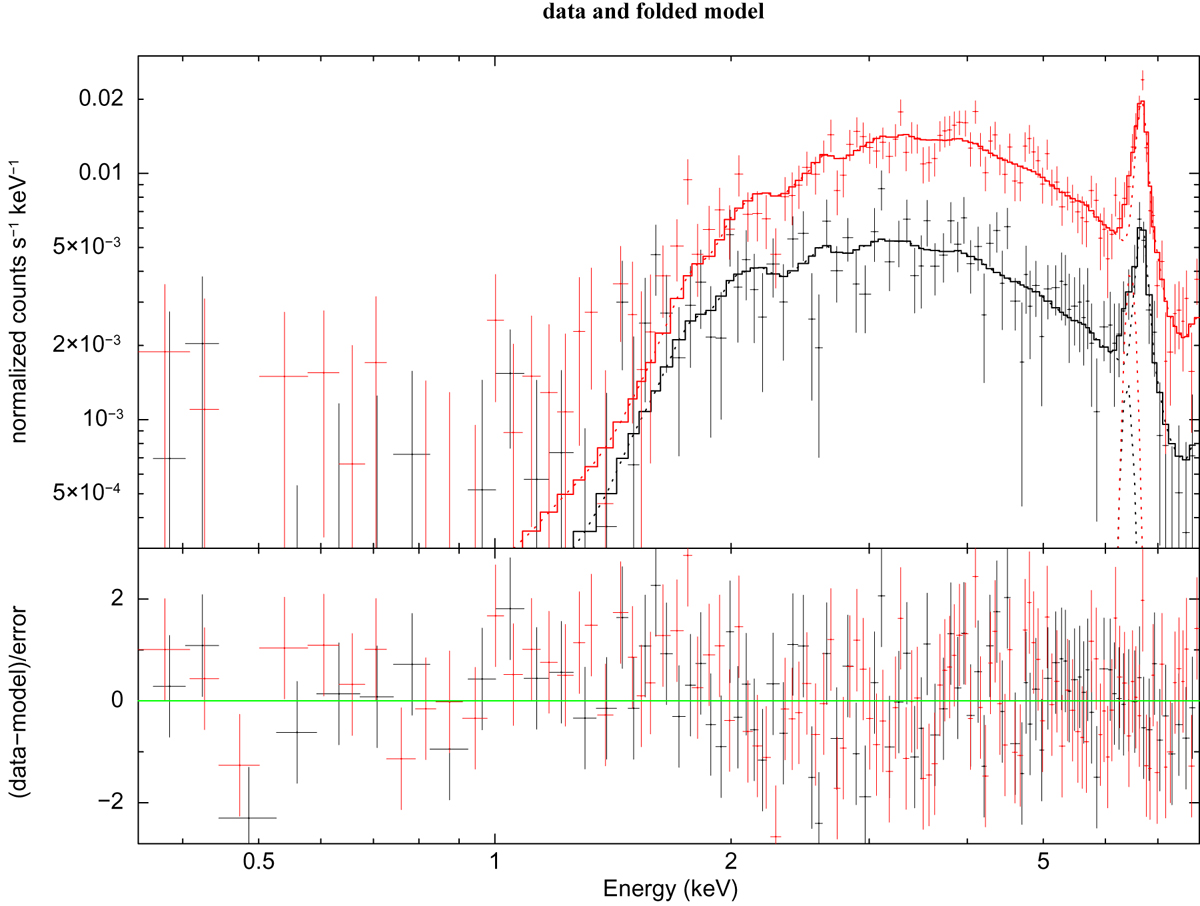
Spectra and best-fit models of the PN detector acquired during the first XMM-Newton exposure (red symbols) and the third exposure (black symbols). Lower panel: residuals (data – model values). The model for both spectra is an absorbed thermal APEC component plus a Gaussian to take into account the fluorescent emission from partially ionized Fe lines at 6.4 − 6.5 keV. The difference between the two spectra is due to a difference of EM.
Current usage metrics show cumulative count of Article Views (full-text article views including HTML views, PDF and ePub downloads, according to the available data) and Abstracts Views on Vision4Press platform.
Data correspond to usage on the plateform after 2015. The current usage metrics is available 48-96 hours after online publication and is updated daily on week days.
Initial download of the metrics may take a while.